India far from meeting its potential in economic and social rights
The Human Rights Measurement Initiative (HRMI) is the first global initiative to track the human rights performances of countries. This case study focuses on the economics and social rights outcomes for India, and can be treated as a press release for media. All data discussed below are available on our Rights Tracker. See also HRMI’s Research credentials. This country spotlight refers to data published in 2020.
India can make huge improvements in economic and social rights
It’s hard to practise good hand hygiene if you don’t have access to running water in your home. It’s difficult to fight off a virus if you are already malnourished. As India attempts to contain the spread of the COVID-19 pandemic with radical restrictions on people’s movement, its existing human rights challenges, particularly in the area of economic and social rights, have never been more urgent.
This article outlines some of the gains India could make for its people if it can turn its attention to fulfilling their fundamental human rights to food, health, and adequate housing, among other economic and social rights.
Some of the headlines from below:
- India is only achieving 61.4% of what is possible with its current resources to make sure people’s rights are fulfilled.
- If India were operating at best practice in its respect for the right to health, about 3.5 million additional children would have a much better chance of reaching their fifth birthday.
- India could lift over 730 million people out of absolute poverty without any increase in per capita income.
- If India used its resources effectively, an additional 530 million people would have access to basic sanitation and an extra 490 million people would have access to water on site.
- India ranks the lowest in South Asia for the right to work and earn a decent living. India’s policymakers could look to many of its neighbours with similar incomes who are doing much better, for example Sri Lanka, to get ideas of policies and programs that could reduce absolute poverty even in the absence of income growth.
Read on for more detail. You can read every section, to understand HRMI’s data in detail, or skip to the India-specific sections, for some examples of how India’s change-makers can use our data to work for human rights improvements.
How do HRMI’s data work?
HRMI data can help boost efforts to improve people’s lives in India by providing quantitative measures of government performance on economic and social rights (ESR) outcomes.
Each rights score can be used to show whether the government is doing as much as it can within the constraints of its current resources; how much improvement is needed to fulfil a given right; and the extent of rights performance progress or deterioration over time.
By comparing scores on different rights and right indicators, countries can learn where the greatest improvements can be made, and where change is needed most, even in the absence of economic growth.
By looking to countries with similar resources but better ESR performance, countries can gain new insights into the sorts of policies and measures that are likely to improve rights outcomes.
So, how does HRMI assess country performance on economic and social rights? HRMI’s ground-breaking methodology allows us to score countries on how well they use their income for economic and social rights outcomes. In particular, the rights to education, food, health, housing, and work. To calculate a country’s ESR scores we use the SERF Index methodology, developed by HRMI co-founder Susan Randolph and her colleagues Sakiko Fukuda-Parr and Terra Lawson-Remer.
The SERF Index combines country achievement and country income to produce a ‘best practice’ benchmark that records the best results that any country has achieved over the last 20 years, at every income level. Each country’s current achievement level is then compared to the best practice benchmark for its income level, and the country’s ESR score is given as a percentage of that result.
HRMI’s ESR scoring methodology takes income into consideration, so it can assess all countries on a level playing field. The way it takes income into account simultaneously reveals the areas that a country can improve their rights performance in, and by how much, even without more income or resources.
When a country scores 100% on the performance of a right, it means that the government is keeping its human rights promises to do the very best for its people within the constraints of the country’s current resources.
All countries can score 100%. So any score that’s less than 100% shows that there’s a gap between how that country is doing, and the best result of any other country with the same level of income. An underperforming country can use HRMI’s scores to see which of their neighbours or peers are doing better and source policy lessons from them.
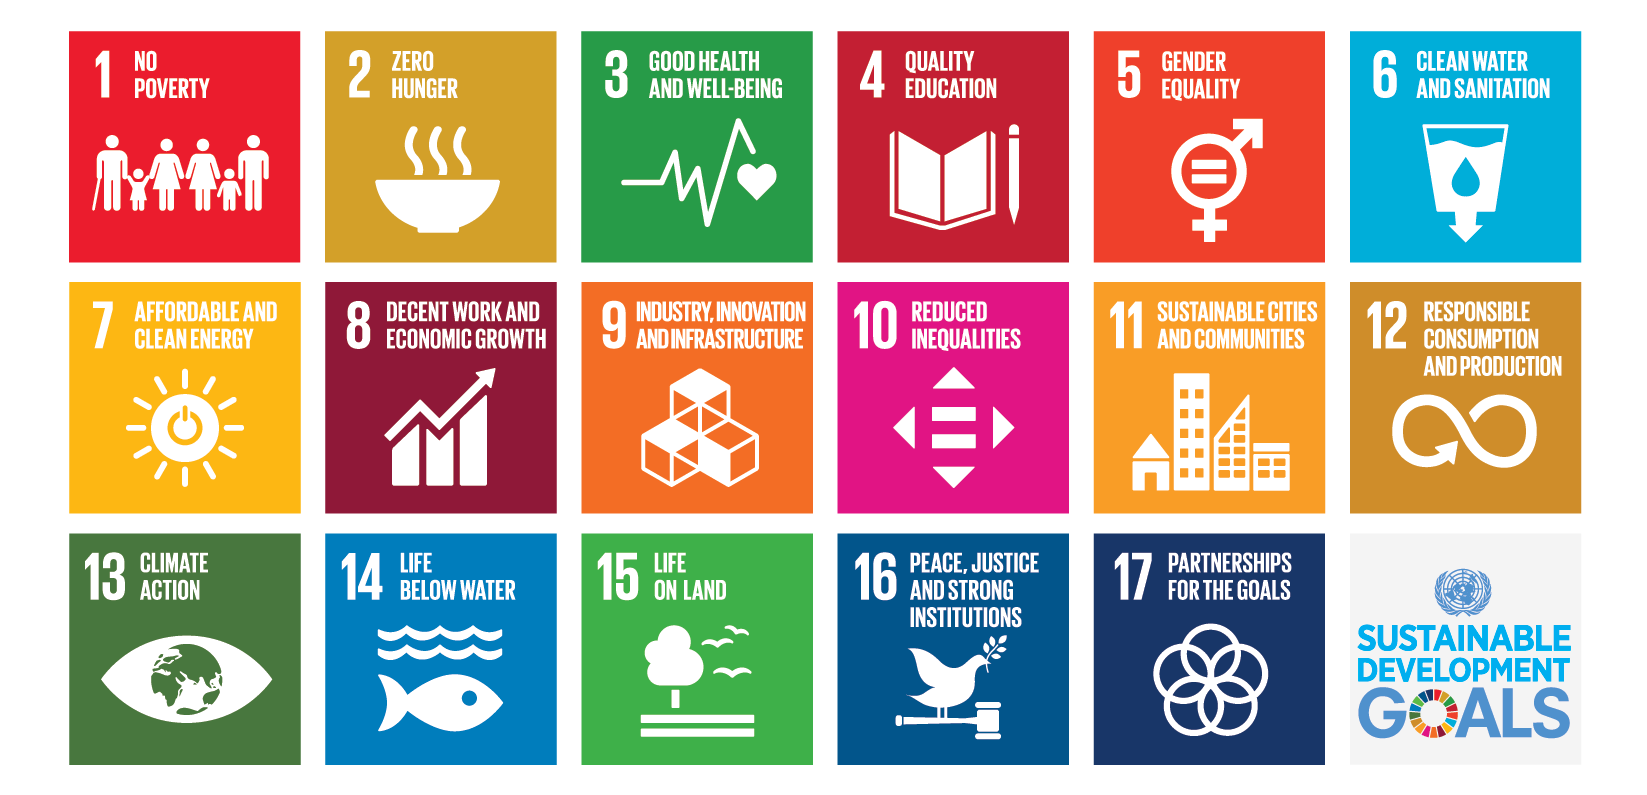
There is a lot of cross-over between HRMI’s human rights performance indicators and the UN’s Sustainable Development Goals (SDGs) targets and benchmarks. Countries can use HRMI’s scores to evaluate their own progress and their potential to reach the 2030 Agenda for Sustainable Development, given their current level of income.
HRMI’s benchmarks and assessment standards
HRMI’s methodology uses two benchmarks and two assessment standards when evaluating a country’s ESR performance.
The first benchmark is the ‘income adjusted’ benchmark. Using this benchmark, countries are compared with other countries of a similar income level, allowing us to evaluate how effectively each country is using its available resources. The second benchmark is the ‘global best’ benchmark. This benchmark evaluates country performance relative to the best performing countries at any level of resources.
Both benchmarks are useful for different purposes. The country scores measured against the income adjusted benchmark show how effectively a country is using its resources to achieve good rights outcomes. This also tells us how much its performance can be improved even without extra income. The scores measured against the global best benchmark show how far a country has to go to do as well as any country in the world. These global best scores are important because even if a government is doing its best with their current resources (so it has an income adjusted rights score close to 100%), a country with very low income will likely still have many people not fully enjoying their human rights, which will be reflected in low scores when measured against the global best benchmark.
The assessment standard tells us which collection of rights indicators we use to evaluate the ESR performance of a country. The difference between the two assessment standards is to do with the availability and relevance of data for low and middle income countries versus high income countries.
The low and middle income assessment standard includes rights indicators which low and middle income countries are more likely to have data on, and/or which are more relevant to the rights challenges they currently face. The high income assessment standard includes rights indicators high income countries are most likely to have data on, and/or which are more relevant to the rights challenges they face.
For example, when figuring out how well countries are doing at fulfilling the right to education, for low and middle income countries we look at primary and secondary school enrolment rates. This tells us about access to education. Both indicators are widely available for low and middle income countries and vary widely across them.
But in high income countries, primary school enrolment is essentially universal, so this indicator isn’t a very useful measure of access to education. Instead, for our high income assessment standard we use the secondary school enrolment rate as our single indicator of access, but we also include an indicator of school quality: student performance on the Program for International Student Assessment (PISA) tests. School quality is no less a concern for low and middle income countries, but unfortunately, at this time there is no test of student performance that is widely used by low and middle income countries.
We do produce scores on all indicators for all countries if the data are available. So, for example, you can see HRMI scores related to a low income country’s PISA results if that country participates in the PISA assessments.
It can be useful to toggle between the two assessment standards, and check out our scores on the individual indicators, on the country pages of the Rights Tracker.
HRMI’s data are useful for India’s change-makers
India’s overall Quality of Life score
For countries that have sufficient data across all five economic and social rights (the rights to education, food, health, housing, and work), an overall Quality of Life score can be calculated.
India has a Quality of Life score of 61.4% when scored against the income adjusted benchmark (shown below). This score means India is only achieving 61.4% of what is possible with its current resources to make sure people’s Quality of Life rights are fulfilled.

If we look at India’s Quality of Life score measured against the global best benchmark, its score goes down slightly to 59.4%. This score tells us that India has a very long way to go to meet current ‘global best’ standards for ensuring all people have adequate food, education, healthcare, housing and work.
India’s economic and social rights scores
Here we explore the economic and social rights performance of India using the income adjusted performance benchmark and the low and middle income assessment standard. To do so for any country, visit our Rights Tracker and click on the relevant performance benchmark and assessment standard buttons as shown below.

You can compare India’s five rights scores with other countries’ scores by clicking on each of the rights: right to education, right to food, right to health, right to housing, and right to work. On each of these rights pages, you can also click on the ‘Add country filter’ button to compare South Asian countries and see how India is performing relative to other countries in its region.
Note: The majority of the indicator data used in constructing India’s rights scores are relatively up-to-date. Data on India’s right to health and housing indicators were collected in 2017, and data on the right food were collected in 2015. However, for the right to education and the right to work, data on the relevant indicators were last observed in 2013 and 2011, respectively. For these latter two rights, it is possible that India’s performance improved, but to learn whether that is the case we will need to wait until the relevant data are available from publicly accessible international databases.
Right to Education
India’s right to education score is 77.0%, which is relevant for SDG 4: Quality Education and SDG 1: No poverty. Clearly, India can do a lot better even without growing its economy.
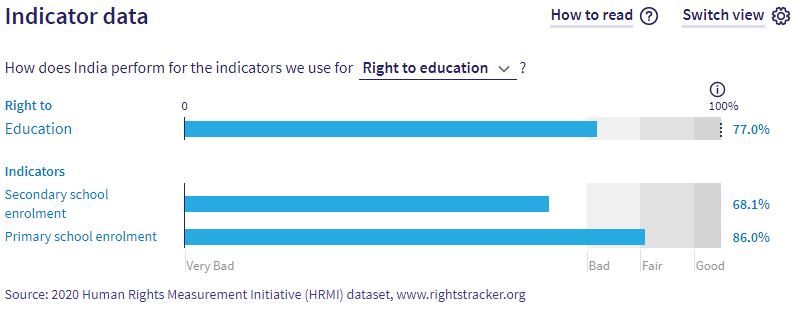
The right to education score is the average of the two underlying indicator scores: secondary school enrolment, and primary school enrolment. By looking at the scores on each of these underlying indicators, we can gain greater insight into where India needs to focus its efforts. India’s score on primary school enrolment is 86.0%. There is room for some improvement here, but India’s greatest deficit concerns access to secondary school. Only 61.6% of India’s secondary school aged children are enrolled in secondary school, whereas given India’s current level of income, it should be able to ensure that 90.5% of its secondary aged students are enrolled in secondary school. Thus India is only achieving 28.9% of what it should be able to for ensuring access to secondary education.
If India were using its resources effectively, an additional 11.8 million primary school aged children would be enrolled in primary school, and an additional 43 million secondary school aged children would be enrolled in secondary school.
Right to Food
The right to food relates directly to SDG 2: Zero Hunger, for which the goal is to end all forms of starvation by 2030. For our low and middle income assessment standard, we use the child (under 5) stunting rate as a high-level ‘bellwether’ indicator of the percentage of children that are not getting enough energy, vitamins, and minerals from their diets to grow normally. We then flip this statistic to give us the percentage of children that are not stunted. (For more on this, please see our Methodology Handbook).
In India, 61.6% of children under five are not stunted. This figure is India’s raw value for the children not stunted indicator. We then adjust this raw value for India’s current level of income and what we call the “natural minimum”—the lowest percentage of well-nourished children observed in any country over the past 25 years, to get the income adjusted indicator score of 48.2%.
If India were to operate at its full potential given its current resources, an extra 39 million children under five would not be stunted.
When comparing India’s right to food score with other South Asian countries with available data, we see that India is ranked seventh out of eight, lower than all but Pakistan.
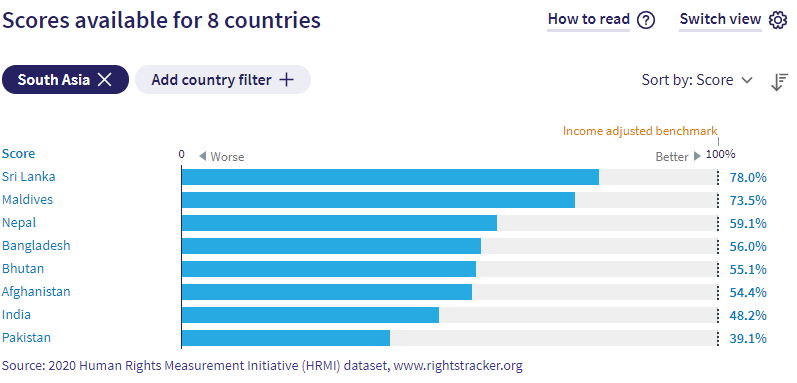
Country comparisions are important not just to help spark a race to the top, where countries compete to improve how they treat their people, but also because by looking at the policies and practices of higher performing neighbours, countries can learn from what others are doing well, and open up new avenues of progress.
Right to Health
India’s right to health score is 80.7%. This score is calculated from three indicators reflecting access to quality reproductive, child, and adult healthcare: modern contraceptive use by women ages 15 to 49 years who are married or in-union; children surviving to age five; and adult survival, respectively.
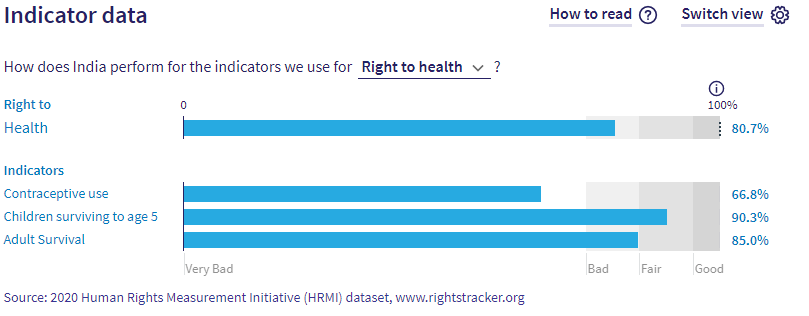
Collectively, these three health indicators relate to SDG 3: Good Health and Well-being, as well as SDG 1: No Poverty.
When looking at the gender differences in the adult survival indicator score within India, we see that females have a score of 88.6% while males have a score of 83.5%. As shown on the screenshot below, these results suggests Indian females have a ‘Fair’ adult survival score but Indian males have a ‘Bad’ adult survival score.
While these scores may appear relatively high in percentage terms, the thresholds show us that none of India’s indicator scores are ‘Good’. Even though India’s child survival score is considered ‘Fair’, consider the health gains that could be gained by children under five:
If India were operating at best practice, approximately 3.5 million extra children would have a much better chance of reaching their fifth birthday.
Right to Housing
India’s ESR score for the right to housing is 60.7%. This score is averaged across two indicators: access to at least basic sanitation (with a HRMI ESR score of 60.1%), and access to drinking from an improved water source on site (with a score of 61.4%).
These indicators relate to SDG 1: No Poverty, SDG 6: Clean Water and Sanitation, and SDG 11: Sustainable Cities and Communities.
If India used its resources effectively, an additional 530 million people would have access to basic sanitation and an extra 490 million people would have access to water on site.
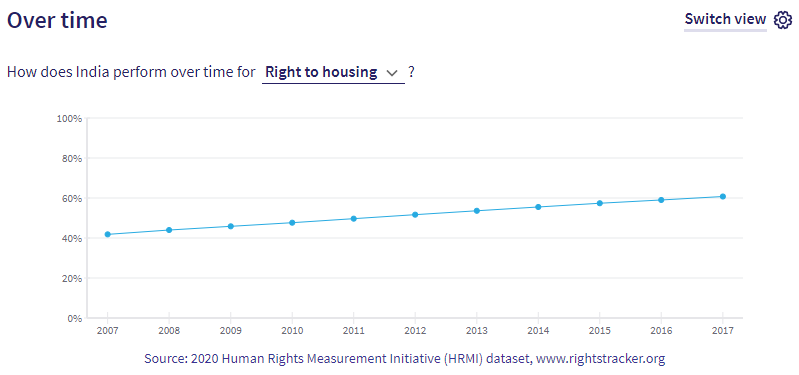
HRMI’s Rights Tracker also allows us to track a country’s rights performance over time. The screenshot below shows that India has made slight progress in fulfilling the right to housing between 2007 and 2017. Given India’s right to housing data have been continually updated on an annual basis, the over time trend line does demonstrate consistent improvement in India’s right to housing outcomes. But even without increasing per capita income, India could dramatically improve the enjoyment of the right to housing.
Right to Work
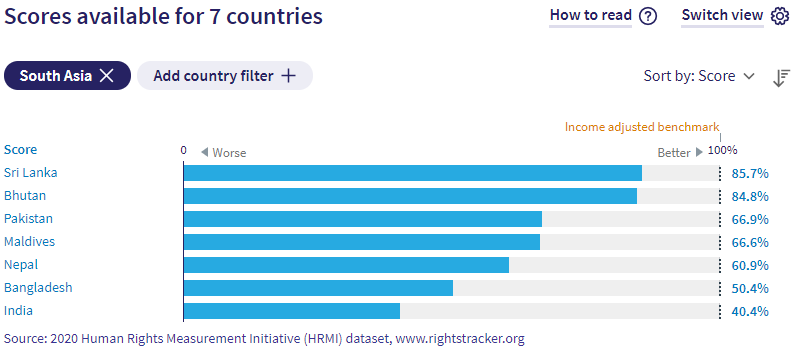
India’s right to work score is 40.4%, as measured by the percentage of people not in absolute poverty, where the absolute poverty line is set at $3.20 (2011 PPP$) per day.
This means India is only achieving 40.4% of what should be possible with its current income to ensure the right to work is enjoyed by all.
If India were operating at its full potential given its current resources, it could lift 730 million people out of absolute poverty.
Significantly, when we compare India’s right to work score with other South Asian countries with sufficient data, India ranks the lowest. Again, this tells us that India’s policymakers could look to many of its neighbours with similar incomes who are doing much better (for example Sri Lanka, whose income adjusted right to work score is 85.7%), to get ideas of policies and programs that could reduce absolute poverty even in the absence of income growth.
Next steps: what can you do now?
If you are advocating for human rights in India, or working towards the SDGs, HRMI data can point out new opportunities for progress. Here are some ways Indian advocates, activists, and policy makers can use our data to lead change:
- Look for the countries that are similar to India in income, but scoring much better. You can filter the rights pages on our Rights Tracker by region and income level, so just click on these rights to get started, and choose a filter at the top left: right to education, right to food, right to health, right to housing, and right to work.
You can find which countries have similar levels of income using this list, arranged by GDP per capita.
- Ask what those similar and high-performing countries are doing differently.
- Copy key facts from the Rights Tracker and this article to use in your reports and advocacy. Isn’t it compelling to tell the government, or the public, that with better management, approximately 3.5 million more children could live past their fifth birthday?
All our data are freely available for you to use. We would love to hear if you use our work!
- Watch out for the next annual update of the scores in May or June each year – is India improving, either in its score or its place on the table?
- Get in touch with us if you need any help at all. We would be delighted to partner with you in your work to improve people’s lives.
Thanks for your interest in HRMI. To further explore our human rights data for India, please visit our Rights Tracker, where you can find data by country or right.


