Human rights defenders fight an uphill battle in the United States
By HRMI Researchers Natalie Speier and Livvy Mitchell.
Across the United States, millions of people are calling for the government to respect their basic civil and political rights.
Our data show worrying levels of state-based violence and limited rights to political participation and freedom of expression in the US, especially for people of colour and indigenous people. In 2018, almost 1,000 people were killed by law enforcement workers using firearms. Under these difficult conditions, it is inspiring to see the daily work of activists and advocates such as the Black Lives Matter movement in making their country a safer place to live.
President Trump continually threatens Americans’ right to freedom of expression by openly attacking media outlets. In September of 2019, the President actively sought to reveal the identity of a whistleblower in a US intelligence agency and stated that such whistleblowers should be executed. Human rights defenders and journalists in the United States continue to document abuses of press freedom as part of their struggle for independent media.
Although civil and political rights are a current focus in the US, it’s also important to talk about economic and social rights — for example the right to health, to education, and to work. Our research shows that if the United States used its existing resources better, millions more Americans could be enjoying their basic human rights.
The right to health has a lot for room for improvement. The Office of the High Commissioner of Human Rights (OHCHR) noted in its 2015 report that the Affordable Care Act excluded coverage for millions of undocumented immigrants residing in the US, limiting their access to affordable healthcare. Migrant children were held in inhumane conditions without contact with family members or access to medical care for weeks at a time at the Mexican-American border in 2019.
Women are another group whose right to health is at risk. The Trump administration has repeatedly attempted to restrict access to reproductive healthcare and currently, under the Affordable Care Act, employers can be exempted from covering contraception in employee health insurance plans by citing religious or moral objections.
In the United States, violations of the right to education are affected by race. A significant portion of students who belong to ethnic or racial minorities continue to attend segregated schools. School districts that serve students of colour are underfunded in comparison to white school districts, leading to a large disparity in the quality of education that students receive.
The right to work is another area where human rights advocates are striving for change. Currently in the US about 40 million people live in poverty, many of them in households where at least one wage earner receives the federal minimum wage. That’s the equivalent of the whole population of California. Our data suggest that, by using its resources more efficiently, the United States could lift these people out of poverty without any increase in GDP. Across the US, economists, worker alliances, and national campaigns are collaborating to help Americans enjoy the right to decent work.
Rights violations in the United States are affected by race and class. Across the board, people of colour, indigenous people, and poor people are identified as being at greater risk of economic and social rights violations in the United States. By working to provide its people with basic human rights, the US would also start to reduce racial inequality and the inequalities stemming from its history of colonisation.
Overall, the US could improve greatly in providing its people with basic human rights. Some headlines from this article:
- If the US were to operate at its full potential, over 20 million more people would enjoy food security.
- If the US were operating at best practice, an extra 110,000 children would have a much better chance of reaching their fifth birthday.
- If the US used its resources efficiently, 32.5 million more people would have access to safely managed sanitation facilities.
- If the US was operating at its full potential, 44.8 million people would be lifted out of relative poverty and 1 million unemployed people would avoid long-term unemployment.
- If the US used its resources efficiently, an additional 1.9 million children would be enrolled in secondary school.
In this article, you can read every section to understand HRMI’s data in detail, or you can skip to the US-specific sections for some examples of how the United States’ change-makers can use our data to work for human rights improvements.
How do HRMI’s data work?
HRMI data can help boost efforts to improve people’s lives in the US by giving definitive scores measuring government performance on economic and social rights outcomes. Each rights score can then be used to show where change is needed most and how these changes can be achieved.
So, how does HRMI work? HRMI’s ground-breaking methodology allows us to score countries on how well they use their income for economic and social rights (ESR) outcomes. In particular, our current data focus on the rights to education, food, health, housing, and work. To calculate a country’s ESR scores we use the SERF Index methodology, developed by HRMI co-founder Susan Randolph and her colleagues Sakiko Fukuda-Parr and Terra Lawson-Remer.
The SERF Index combines country achievement and country income to produce a ‘best practice’ benchmark that records the best results that countries have achieved over the last 20 years, at every income level. Each country’s current achievement level is then compared to the best practice outcome for its income level and is given an ESR score as a percentage of that result. So any score that is less than 100% is showing that there is a gap between how that country is doing, and the best result of any other country with the same level of income.
The ESR scoring methodology takes income into account so it can assess all countries on a level playing field. The way it takes income into account simultaneously reveals the areas that a country can improve their rights performance in, and by how much, even without more income or resources.
When a country scores 100% on the performance of a right, it means that the government is keeping its human rights promises to do its very best for its people within the constraints of the country’s resources. All countries can score 100%. Any score below 100% shows that there is realistic room for improvement, even at the country’s current level of resources. An underperforming country can use HRMI’s ESR scores to see which of their nearby countries are doing better and identify policy lessons from them.
There is a lot of cross-over between HRMI’s human rights performance indicators and the UN’s Sustainable Development Goals (SDGs) targets and benchmarks. Countries can use HRMI’s scores to evaluate their own progress and their potential to reach the 2030 Agenda for Sustainable Development, given their current level of income.
HRMI’s benchmarks and assessment standards
HRMI’s methodology uses two benchmarks and two assessment standards when evaluating a country’s ESR performance.
The first benchmark is the ‘income adjusted’ benchmark. Using this benchmark, countries are compared with other countries of a similar income level, allowing us to evaluate how effectively each country is using its available resources. The second benchmark is the ‘global best’ benchmark. This benchmark evaluates country performance relative to the best performing countries at any level of resources.
Both benchmarks are useful for different purposes. The country scores using the income adjusted benchmark show how effectively a country is using its resources to achieve good rights outcomes. This also tells us how much the country’s performance can be improved even without extra income. The scores measured against the global best benchmark show how far a country has to go to do as well as any country in the world. These global best scores are important because even if a government is doing its best with their current resources (so it has an income adjusted rights score close to 100%), a country with very low income will likely still have many people not fully enjoying their human rights. The deficit will be reflected in low scores when measured against the global best benchmark.
The assessment standard tells us which collection of rights indicators we use to evaluate the ESR performance of a country. The difference between the two assessment standards has to do with the availability and relevance of data for low and middle income countries versus high income countries.
The low and middle income assessment standard includes rights indicators which low and middle income countries are more likely to have data on, and/or which are more relevant to the rights challenges they currently face. The high income assessment standard includes rights indicators high income countries are most likely to have data on, and/or which are more relevant to the rights challenges they face.
For example, when figuring out how well countries are doing at fulfilling the right to education, for low and middle income countries we look at primary and secondary school enrolment rates. This tells us about access to education. Both indicators are widely available for low and middle income countries and vary widely across them.
But in high income countries, primary school enrolment is essentially universal, so this indicator isn’t a very useful measure of access to education. Instead, for our high income assessment standard we use the secondary school enrolment rate as our single indicator of access, but we also include an indicator of school quality: student performance on the Program for International Student Assessment (PISA) tests. School quality is no less a concern for low and middle income countries, but unfortunately, at this time there is no test of student performance that is widely used by low and middle income countries.
We do produce scores on all indicators for all countries if the data are available. So, for example, you can see HRMI scores related to a low income country’s PISA results if that country participates in the PISA assessments.
It can be useful to toggle between the two assessment standards, and check out our scores on the individual indicators, on the country pages of the Rights Tracker.
HRMI’s data are useful for change-makers in the United States
Let’s explore the economic and social rights performance of the US using HRMI’s ESR data. These data cover the 2007 to 2017 period. The population of the US in 2017 was 325 million, at which time the US had a GDP per capita of $54,470 (in 2011 PPP dollars). Given the US’ high per capita income level, there is likely to be little difference between its scores using the global best benchmark and the income adjusted benchmark. However, to present the US’ scores in the best possible light, in our assessment we use the income adjusted performance benchmark using the high income assessment standard.

Right to Food
The US scored 89.6% on the right to food, which is based on the percentage of the population that is food secure.
We use food security as a high-level ‘bellwether’ indicator to reveal how many Americans have adequate access to food. (For more on this, please see our Methodology Handbook.)
This score means the US is only doing 89.6% of what should be possible with its current GDP per capita to ensure the enjoyment of the right to food. When combining this score with population statistics, HRMI data tells us that:
If the US were to operate at its full potential, over 20 million additional people would enjoy food security.
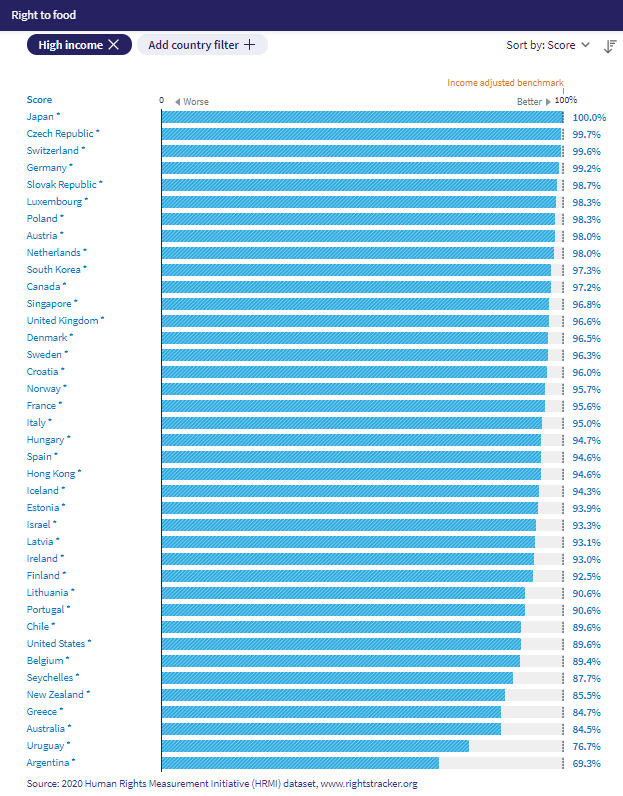
HRMI’s Right Tracker allows us to compare rights scores across countries or groups of countries. As shown below, when comparing right to food scores across high income countries, we can see that the US ranks near the bottom of the list.
This graph tells us that American policy-makers could look to other high income countries who are doing much better (e.g. Japan, Czech Republic, Switzerland, Germany and many others) for examples of ways to make improvements.
Right to Health
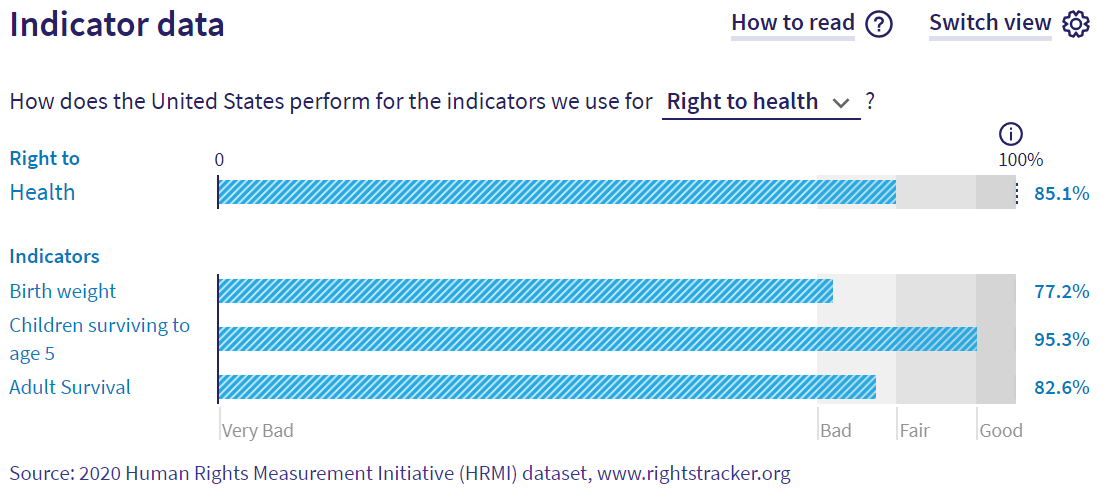
The US scores 85.1% on the right to health.
As shown in the image below, this score comes from three indicators: the percentage of infants who are not low birth weight (score = 77.2%); children surviving to age five (score = 95.3%); and adult survival (score = 82.6%).
On average, these scores tell us that the extent to which Americans enjoy the right to health is 85.1% as high as it could be given the US’ current income level.
Significantly, when we line up all high income countries in order of their right to health HRMI scores, the US is ranked 49th out of 52. Again, US policy-makers could look to better performing high income countries for examples of ways to make improvements for right to health outcomes. In the case of the right to health indicators, the top ranked high income countries are Iceland, Sweden, and Finland.
If the US were operating at best practice, an extra 110,000 children would have a much better chance of reaching their fifth birthday.
Right to Housing
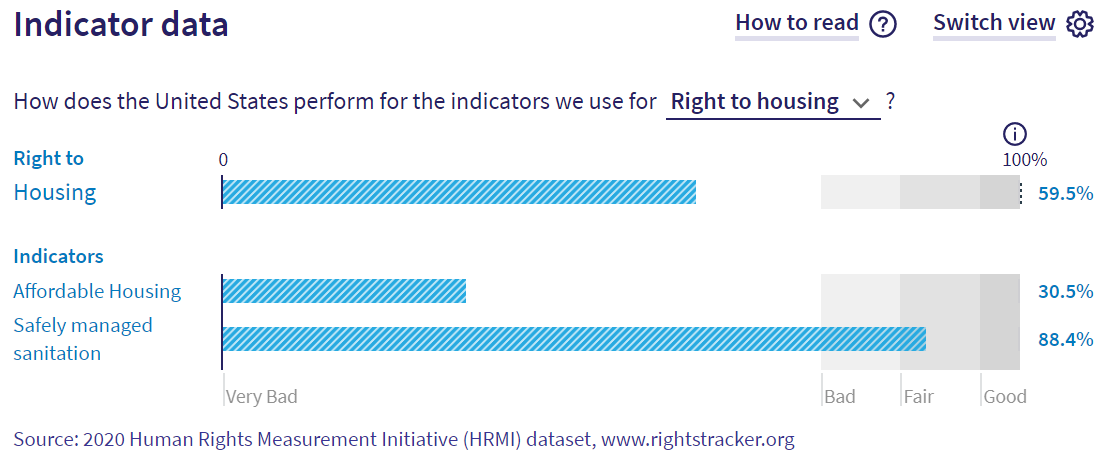
The US scores 59.5% for the right to housing. As illustrated by the Rights Tracker image below, this score is based on two indicators.
The first is affordable housing (score = 30.5%), which is the percentage of the poorest quintile of the population who are living in a household where the cost of rent or mortgage represents less than 40% of total disposable household income (net of housing allowances).
The second indicator is the percentage of the population with safely managed sanitation (score = 88.4%). Safely managed sanitation relates to the use of improved sanitation facilities that separate excreta from human contact and that are not shared with other households.
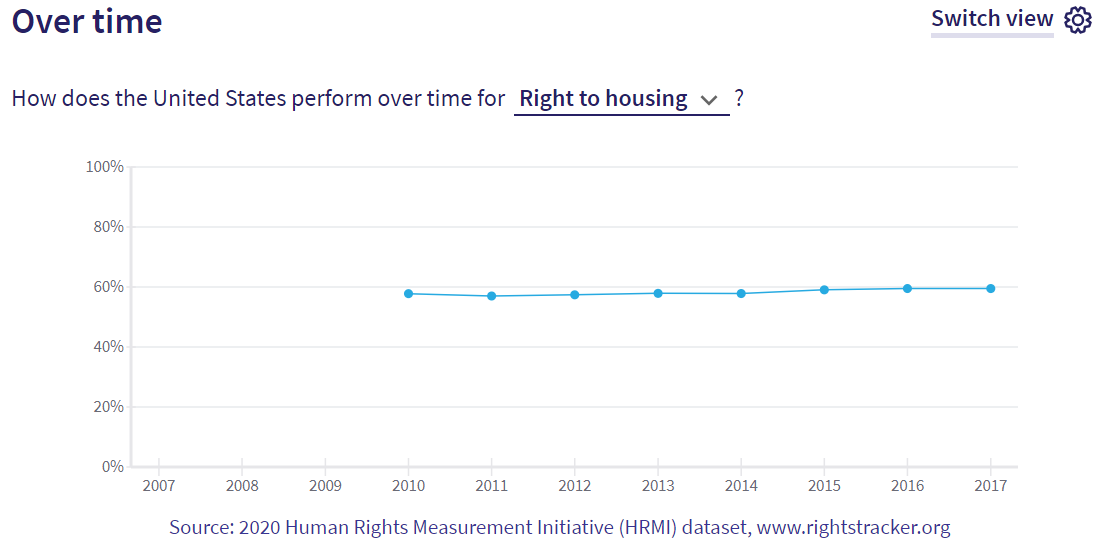
Data on the US’ right to housing outcomes are available each year from 2010 to 2017. This means we are able to track any progress the US has made toward enabling access to safely managed sanitation and affordable housing over an eight year period. The Rights Tracker image below shows the US’ right to housing score over time.
By hovering over each data point on the Rights Tracker, we can see that the US’ right to housing score has largely remained unchanged since 2010, ranging from 57.8 to 59.5%.
This indicates that the US has made very little headway in improving the right to housing for its people.
If the US used its resources efficiently, 32.5 million additional people would have access to safely managed sanitation facilities.
Right to Work
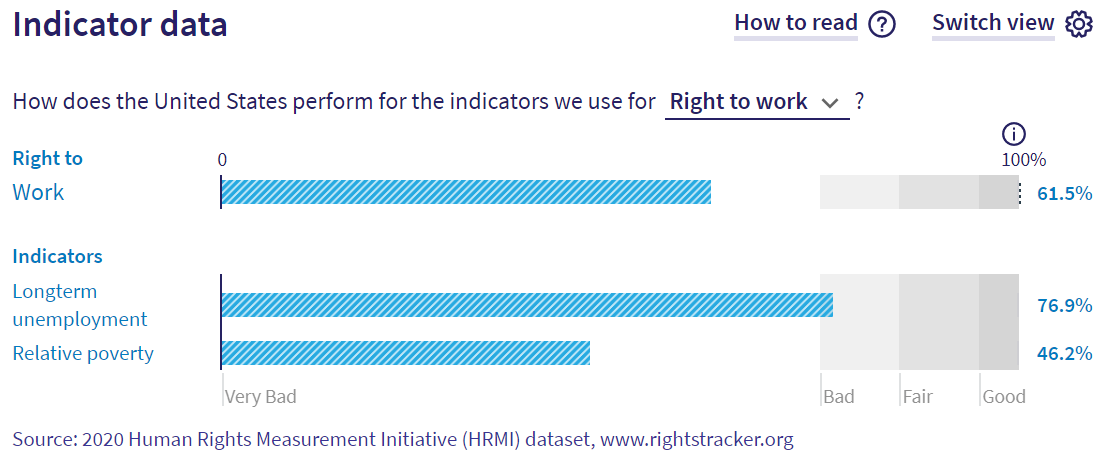
The US’ score for the right to work is 61.5%, which is an average of two indicator scores. These scores mean the US is only achieving 61.5% of what should be possible with its current income to ensure the right to work is enjoyed by all. This is a very poor score, but as shown on the Rights Tracker image below, the US’ performance differs substantially between the two indicators.
The first indicator is the percentage of the unemployment population who are not long-term unemployed (score = 76.9%). Long-term unemployment refers to the number of people with continuous periods of unemployment extending for 12 months or longer, expressed as a percentage of the total unemployed population. As shown by the grey bars, the US’ performance here is categorised as ‘Bad’, but not terrible.
The second indicator is the percentage of the population that is not in relative poverty (score = 46.2%). Relative poverty is based on the equivalised disposable household income concept and is defined as having an income less than 50% of the median income. This score is inexcusably bad.
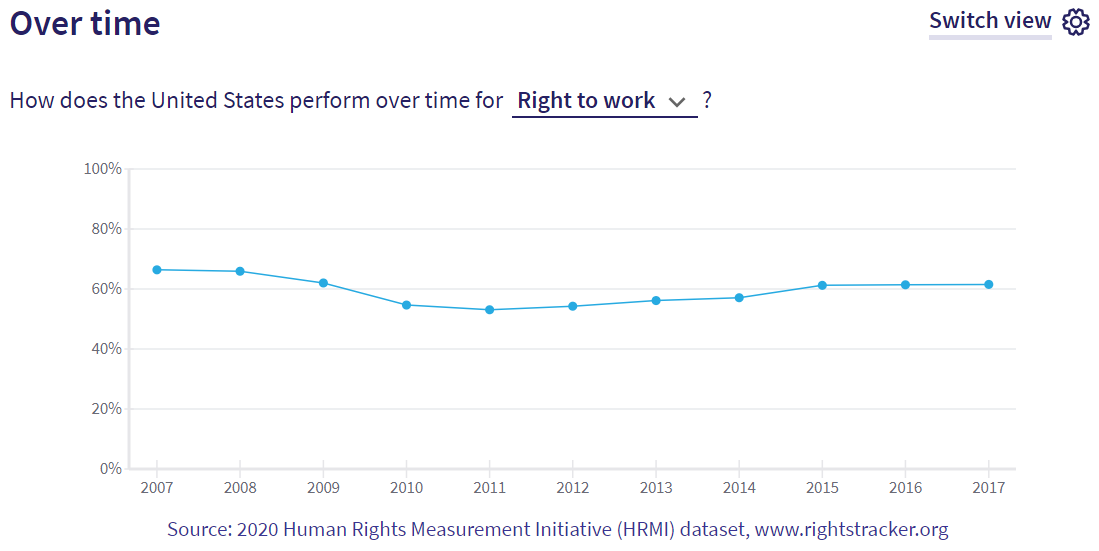
Data are available for the US’ right to work score each year from 2007 to 2017. Therefore, we can use the Rights Tracker over time graph to observe any trend in right to work outcomes for Americans over a ten year period.
The graph above shows that the US has barely made any progress. In fact, the US has regressed in its right to work outcomes, moving from a score of 66.4% in 2007 to 61.5% in 2017.
If the US was operating at its full potential, 44.8 million people would be lifted out of relative poverty and 1 million unemployed individuals would avoid long-term unemployment.
Right to Education
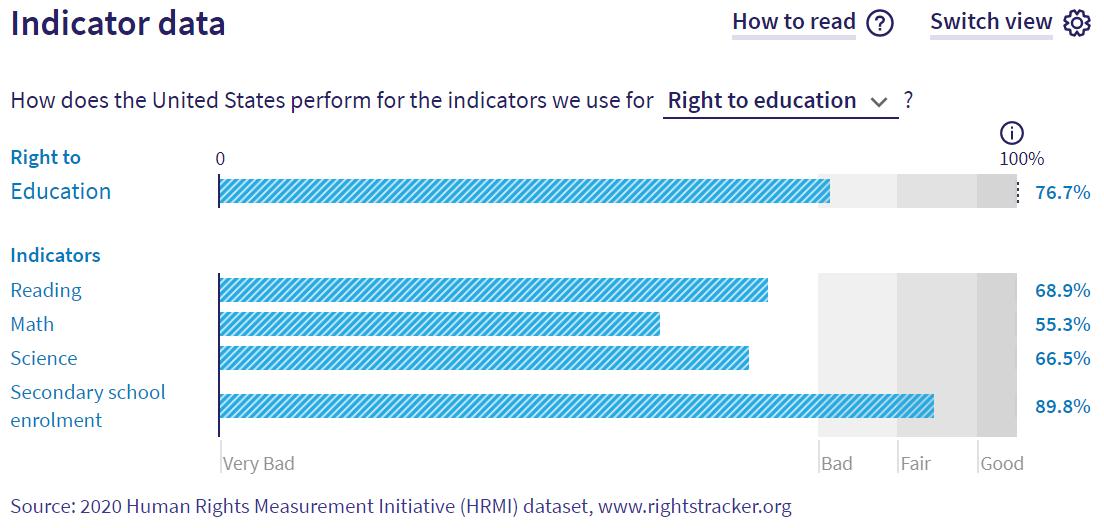
HRMI uses four indicators under the high income assessment standard for the right to education. The first three indicators reflect the percentage of students achieving level 3 or better on math, science and reading PISA tests. The fourth indicator is the net secondary school enrollment rate. HRMI’s overall right to education score is computed by first calculating income adjusted scores for the three PISA tests and then taking the average. This result is then averaged with the country’s secondary education score.
As shown on the Rights Tracker image, the US’ income adjusted scores on the PISA reading, math and science tests are 68.9%, 55.3%, and 66.5%, respectively. The average PISA score is therefore 63.5%. When combining this PISA average with the secondary school enrollment score of 89.8%, the US gets an overall right to education score of 76.7%.
Data are also available for comparing right to education indicator scores between females and males. While all of the US’ PISA scores are considered very poor, the screenshot below shows that American females have better PISA reading scores than American males (75.1% versus 63.8%). On the other hand, males score better on PISA math tests than females (58.4% versus 52.5%), and perform slightly better in PISA science tests than females (68.5% versus 64.5%).
If the US were operating at best practice, an additional 1.9 million secondary school aged children would be enrolled in secondary school.
Overall rights performance of the US
Since the US has sufficient data across all five economic and social rights, we can calculate an overall Quality of Life score.
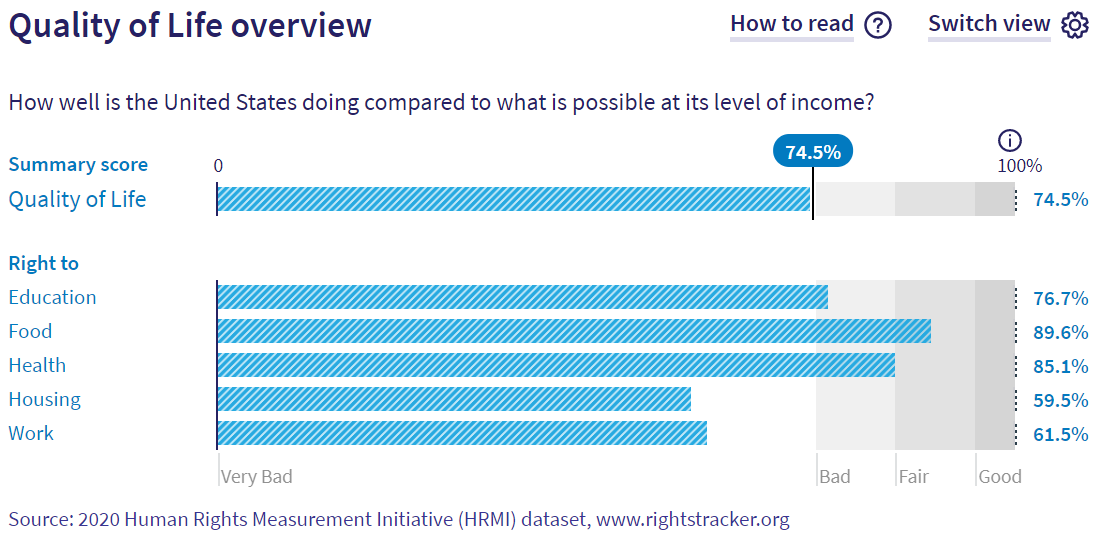
The US’ overall Quality of Life score is 74.5%. This score is an average of all five economic and social rights scores, as shown by the Rights Tracker image below.
This score means that the US is only achieving 74.5% of what is possible with its current resources to make sure people’s Quality of Life rights are fulfilled.
You can compare the US’ five ESR scores with other countries’ scores by clicking on each of the rights: right to education, right to food, right to health, right to housing, and right to work.
Note: Data relating to the US’ economic and social rights indicators are published regularly, which allows HRMI to compute rights scores for the US on an annual basis. Data on the indicators for all five rights were most recently updated in 2017. Therefore, HRMI’s over time graphs on the Rights Tracker are particularly useful for identifying any progress or regress in the US’ ESR performance in the 9-10 years since 2007.
Next steps: what can you do now?
If you are advocating for human rights in the US, or working towards the SDGs, HRMI data can point out new opportunities for progress. Here are some ways you can use our data to lead to change:
1. Look for the countries that are similar to the US in income, but scoring much better. You can filter the rights pages on our Rights Tracker by region and income level, so just click on these rights to get started, and choose a filter at the top left: right to education, right to food, right to health, right to housing, and right to work.
You can find which countries have similar levels of income using this list, arranged by GDP per capita.
2. Ask what those similar and high-performing countries are doing differently.
3. Copy key facts from the Rights Tracker and this article to use in your reports and advocacy. Isn’t it compelling to tell the government, or the public, that with better management, nearly 44.8 million people could be lifted out of relative poverty?
All our data are freely available for you to use. We would love to hear if you use our work!
4. Watch out for the next annual update of the scores in May or June each year – is the US improving, either in its score or its place on the table?
5. Get in touch with us if you need any help at all. We would be delighted to partner with you in your work to improve people’s lives.
Thanks for your interest in HRMI. To further explore our human rights data for the US, please visit our Rights Tracker, where you can find data by country or right.


