10 reasons our ESR scores are uniquely useful for improving people’s lives
Thousands of experts around the world are working hard to make poverty history, and improve the lives of millions of people. It’s not an easy job.
The Human Rights Measurement Initiative (HRMI, pronounced ‘her-mee’) brings new data tools to track progress, and reveal new ways countries can improve their people’s lives, even where resources are very limited.
This short guide to HRMI’s economic and social rights work aims to equip you to use our data for real change.
The power of data
One of the exciting things about HRMI’s work is the evidence that there is tremendous scope to improve people’s wellbeing, even without increasing per capita income.
HRMI uses a ground-breaking new methodology to score countries on how well they use their income for rights outcomes, and reveal possibilities for huge improvements, even without increasing a country’s wealth.
Our scores on the right to food, for instance, show that hundreds of millions of children under five years old could avoid stunting from malnutrition if all countries adopted better policies and practices, even without any more money.
If best practices were followed, we would see these dramatic reductions in malnutrition:
- Timor-Leste, the worst performing low income country in our latest data, could reduce its child stunting rate by 46.7%
- India could reduce it by 33%
- Indonesia could reduce it by 33.2%
- Brunei, the worst performing high income country, could reduce its child stunting rate by 17.4%
Among those four countries alone, that amounts to over 47 million children who could live better lives if countries took notice of our findings.
This is the power of HRMI’s economic and social rights data.
What we do
Economic and social rights, the rights to food, health, education, adequate housing, work, and social security, are at the heart of international human rights law and action.
HRMI is very pleased to be producing annual scores for nearly 200 countries on at least some rights and over 100 countries on all these rights, measuring how well governments are doing at using their available resources to achieve human rights progress in these areas.
Our plan at HRMI is to produce robust, sensible measurements for all human rights, for all countries. We have begun with two suites of metrics, each with its own completely different methodology:
- economic and social rights, using the award-winning Social and Economic Rights Fulfillment (SERF) Index methodology
- civil and political rights, using a pioneering expert survey methodology.
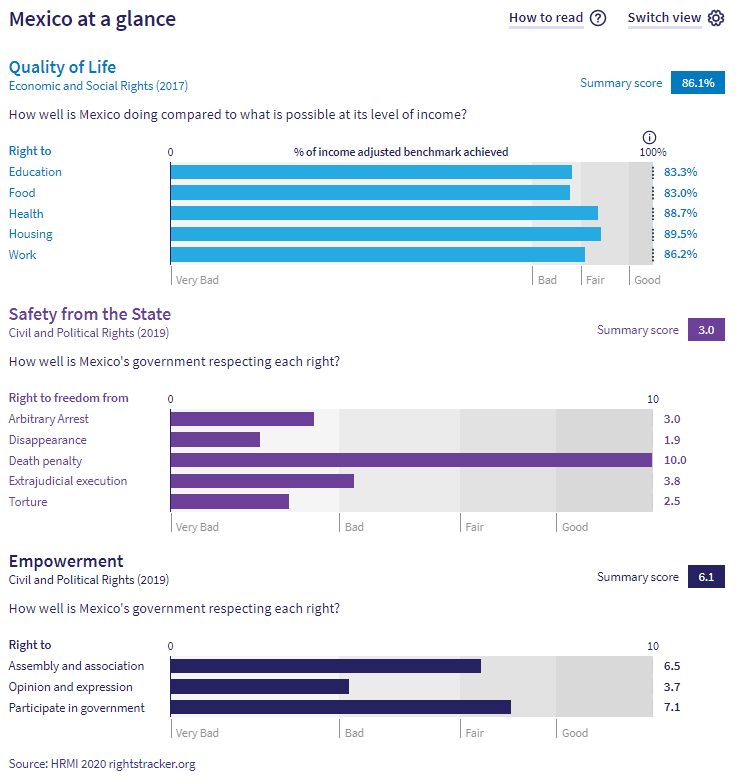
Below is a screenshot of how we present these data on our public Rights Tracker, in this case, for Mexico:
To calculate economic and social rights scores we use the SERF Index methodology, developed by HRMI co-founder Susan Randolph and her colleagues Sakiko Fukuda-Parr, and Terra Lawson-Remer.
Their book detailing this methodology – Fulfilling Social and Economic Rights – won the American Political Science Association prize for the best book in human rights scholarship in 2016, and in 2019, the three authors were awarded the prestigious Grawemeyer Award for Ideas Improving World Order.

Sakiko Fukuda-Parr, Susan Randolph, and Terra Lawson-Remer, winners of the 2016 American Political Science Association prize for the best book in human rights scholarship and the 2019 Grawemeyer Award for Ideas Improving World Order.
For more information on how the SERF Index works, you might like to watch Susan Randolph’s TEDx talk on measuring economic and social rights or read our detailed methodology handbook.
Below are some of the key ways our scores can be useful for the work of:
- civil society
- development agencies
- governments
- investors
- funders
- and ordinary citizens.
#1: HRMI economic and social rights scores are grounded in international law
The starting point for our scores is international law, as contained in:
- The International Covenant on Economic, Social, and Cultural Rights (ICESCR) and its associated documents (such as the Limburg Principles, and a series of General Comments from the Committee on Economic, Social, and Cultural Rights)
- The Universal Declaration of Human Rights
- The Convention on the Rights of the Child (and associated Committee Comments)
- The Convention on the Elimination on All Forms of Discrimination Against Women
Article 2 of the ICESCR says each country is obligated to progressively achieve economic and social rights “to the maximum of its available resources.” Essentially, this means that better performance is expected from richer countries.
For this reason, our scores combine two factors:
- What a country is achieving, shown by big-picture bellwether indicators such as infant mortality, or primary school enrolment rates
- The country’s level of income (GDP per capita in PPP dollars).
This is useful because…
…countries around the world have made these promises and signed up to be held accountable to them. Using the scores on our Rights Tracker:
- Advocates can strengthen their arguments for policy and spending changes.
- Governments can track their own progress over time on our Rights Tracker.
- Civil society can evaluate and report on government progress with compelling data.
#2: HRMI economic and social rights scores take income into account
The SERF Index methodology combines those factors – achievement and income – to find the best result that any countries have achieved over the last 20 years, at every level of income. We then compare each country with this best practice frontier, and present the score as a percentage of that target result.
A country that gets 100% is setting the standard, doing as well as or better than any country with that level of income. Every country is capable of getting 100%. A score of 100% means the government is keeping its human rights promises to do its very best for its people. It doesn’t mean everyone in the country experiences full enjoyment of the right.
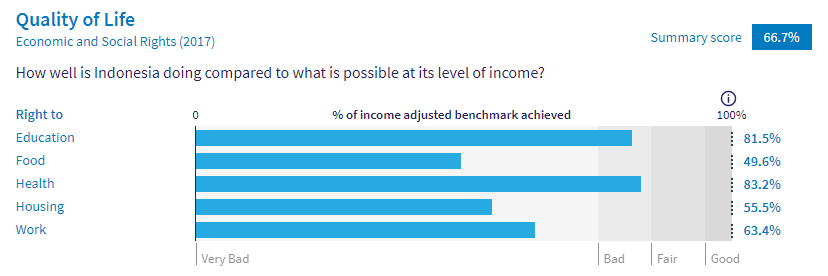
A country that scores 60% is achieving only 60% as much as it could reasonably be expected to, given what we know of how other countries with that level of income perform. Other countries with the same level of GDP per capita have done much better, and set the 100% level – so we know we can expect more.
For example, here are Indonesia’s scores as you see them on the Rights Tracker:
This is useful because…
…countries are assessed realistically according to their available resources. Using the scores on our Rights Tracker:
- Governments can see which of their peer countries are doing better, and what lessons they can learn from their neighbours
- Governments and civil society can call for a) increased development assistance if high scores show money is being used effectively for rights outcomes or b) policy and spending changes if low scores show there’s room for improvement without increased income.
- Funding agencies can see how well income is being translated into rights outcomes, and which countries need more money to improve further.
Note: You can also use the ‘Performance Benchmark’ buttons in the sidebar to switch between the default ‘income adjusted’ scores and the ‘global best’ setting, which shows the gap between a country’s performance and the best performing countries in the world, regardless of income. Click on Switch view in the top right and then select the benchmark to use.

For example, here are Indonesia’s scores as you see them on the Rights Tracker, when the ‘global best’ setting is selected:
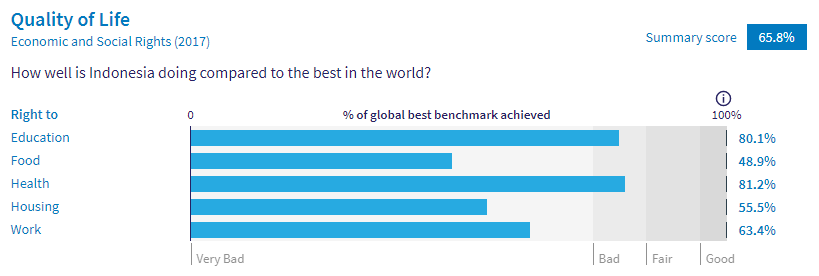
Economic and Social rights scores using the ‘Global best’ performance benchmark for Indonesia from the HRMI Rights Tracker
#3: HRMI economic and social rights scores measure government performance
Our scores measure how well the government is using its resources to achieve human rights outcomes.
This means the successes of lower income countries can be recognised, even though there may be a long way to go for their people to have the same living standards as richer nations. It also means high income countries can be held to account when their wealth is not being used effectively.
For example, here’s the top section of the right to food scores, showing that low and middle income countries like Samoa, St Lucia, and Tuvalu are among the best in the world at translating their limited income into rights enjoyment for their people.
Even if their people are not all well fed, the scores tell us the governments are doing the best they can with their income, and meeting their human rights obligations. If a high-scoring country like Samoa or DRC wants to reduce hunger, it will need more income.
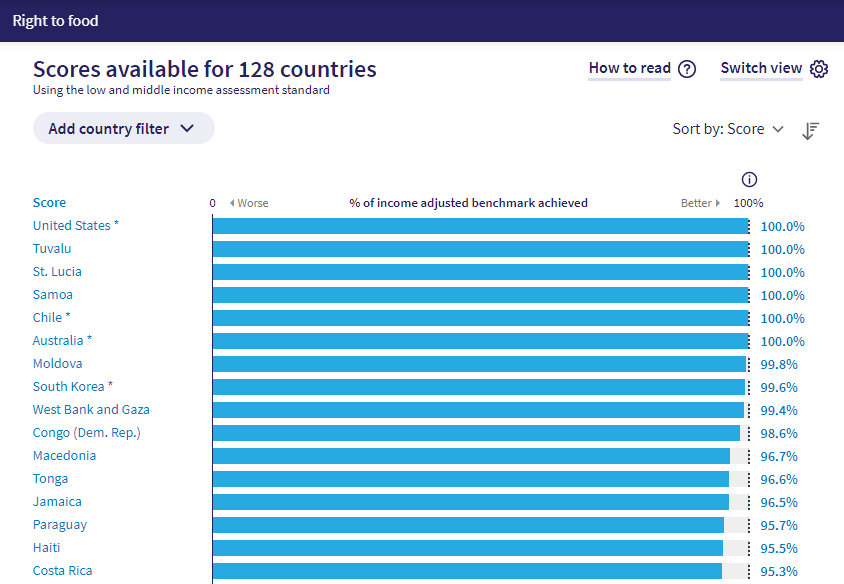
In contrast, here’s the bottom section of that table, showing that Brunei, a high income country, has a long way to go to meet its rights obligations, while several low income countries are also not spending their limited income effectively in order to ensure their peoples’ right to food is fulfilled.
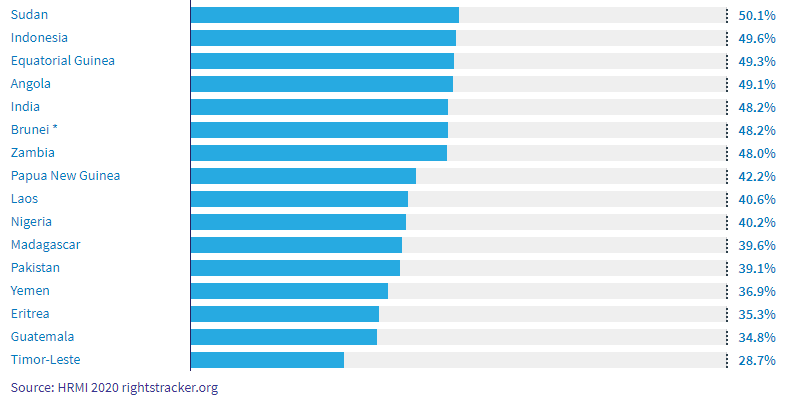
This is useful because…
…governments can no longer say they are doing all they can, but are constrained by resources, if they score less than 100%. Our scoring methodology judges all countries on a level playing field and reveals which ones can be expected to improve, even without more income.
Similarly, low and middle income countries who are following best practice can be recognised for their progress, even if they have further to go in terms of absolute outcomes.
#4: HRMI economic and social rights scores point to specific opportunities for improvement
The gap between a country’s score and 100% is a realistic opportunity for improvement that governments can act on.
A score under 100% means there is a real-life example of countries with similar income doing better, so a government who wants to improve can ask: ‘What is our neighbour doing differently?’ ‘What can we learn from their policies and practices?’
This is useful because…
…underperforming countries can do something constructive with the information that they are not doing as well as they should be.
Using the scores on the Rights Tracker:
- Governments can look to high scoring peer countries for ideas for policy and spending improvements.
- Campaigners can point to specific examples of similar countries scoring better, and make specific policy change suggestions based on these data.
#5: HRMI scores can be applied to the UN’s Sustainable Development Goals
HRMI’s economic and social rights scores are directly useful to measure progress towards the Sustainable Development Goals – and to help find fresh ideas to meet them.
HRMI’s work is entirely independent of governments, so can be valuable for shadow reporting on the SDGs.
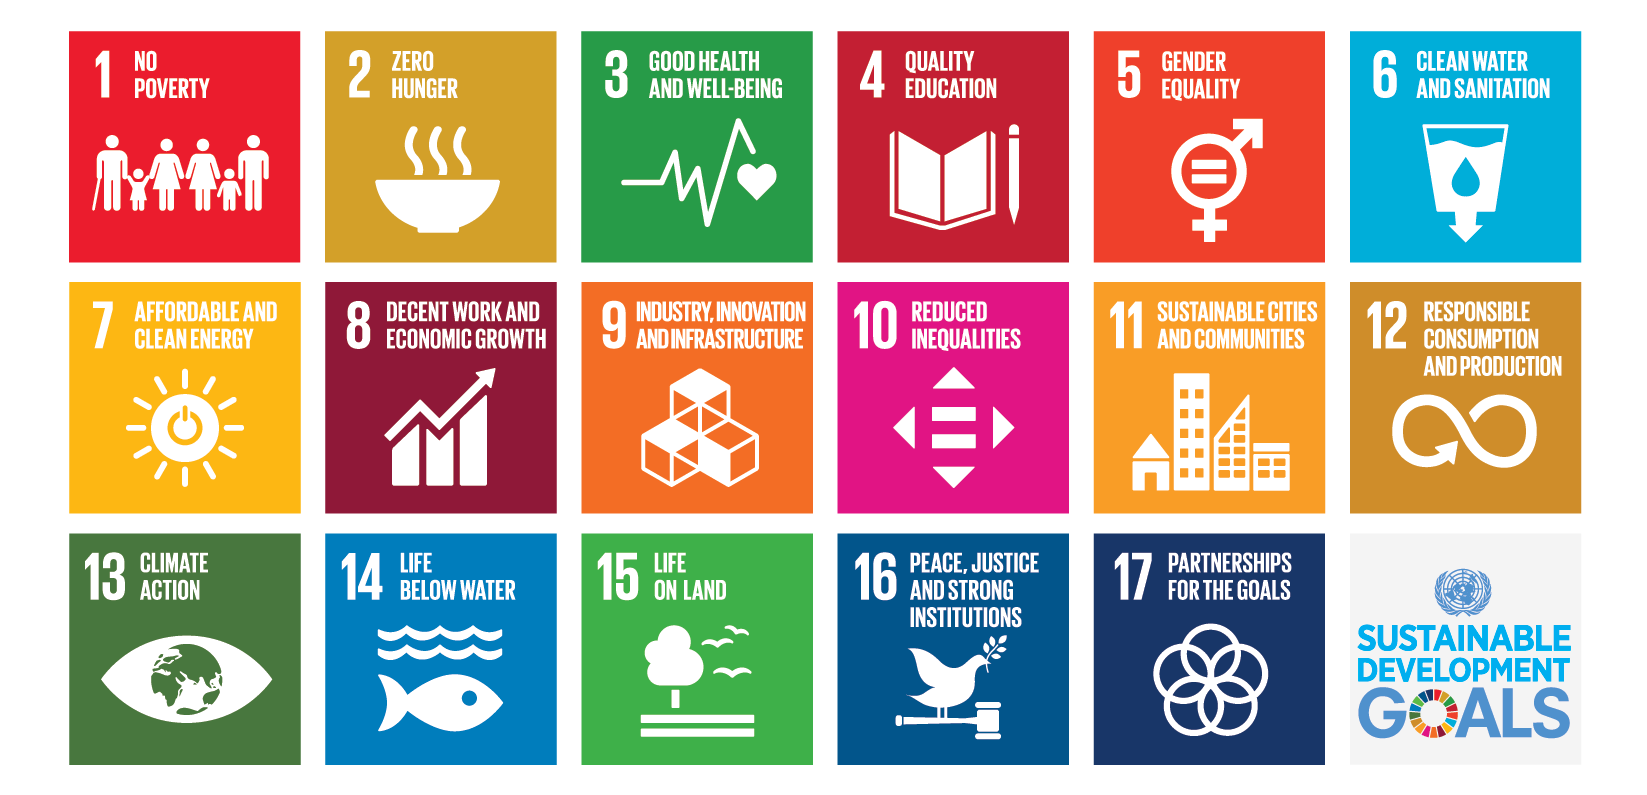
Our right to food scores relate to Goal 2: Zero Hunger.
Our right to education scores relate to Goal 4: Quality Education and Goal 1: No Poverty
Our right to health scores relate to Goal 3: Good Health and Well-being and Goal 1: No Poverty
Our right to housing scores relate to Goal 1: No Poverty, Goal 6: Clean Water and Sanitation, and Goal 11: Sustainable Cities and Communities
Our right to work scores relate to Goal 1: No Poverty and Goal 8: Decent Work and Economic Growth.
Also, our scores on food, health, and education are disaggregated by sex where relevant, which can help in progressing towards Goal 5: Gender Equality.
Our civil and political rights scores are also important for Goal 16: Peace and Justice, Strong Institutions.
If you work on the SDGs, make sure you read Susan Randolph’s important article giving examples of how HRMI scores can be used to make progress towards the SDGs.
#6: HRMI scores can be filtered by region, income level, and other groupings
It’s natural for Pacific countries to want to compare themselves to their regional neighbours, and OECD countries to care most about how they’re doing among that group.
You can easily filter the rights scores to show your country in the context of these kinds of groupings.
For example, here are the scores for the right to education, showing just the countries from the Middle East and North Africa region.
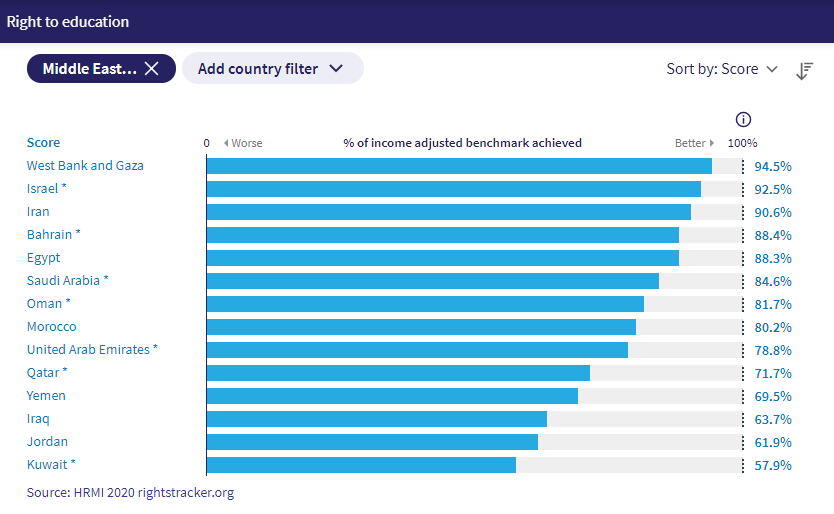
#7: HRMI produces a summary ‘Quality of Life’ score as well as scores for each right
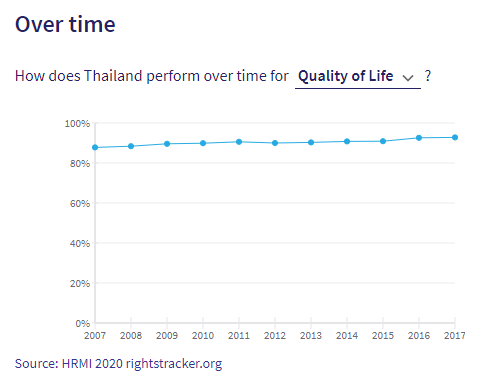
For countries where national statistics are available for all five economic and social rights we measure, we also produce a summary score, called the ‘Quality of Life’ score, which gives the big picture of how well a government is performing.
Some countries might perform much better on some rights than others. The Quality of Life score takes all five scores into account and shows the overall performance, which can be tracked over time.
For example, here are the scores for Thailand, shown as one Quality of Life score, and then the five economic and social rights scores:
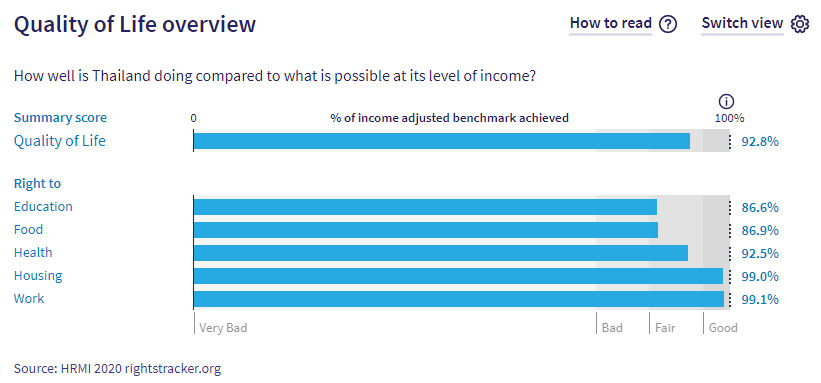
#8: We use a range of indicators matched to income level
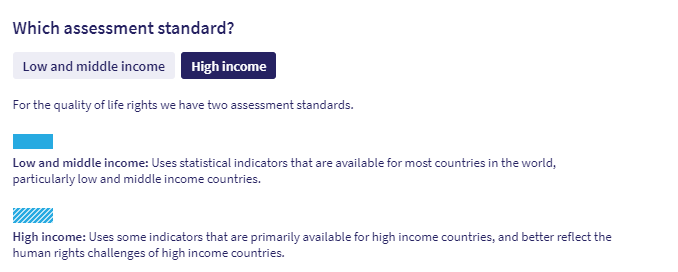
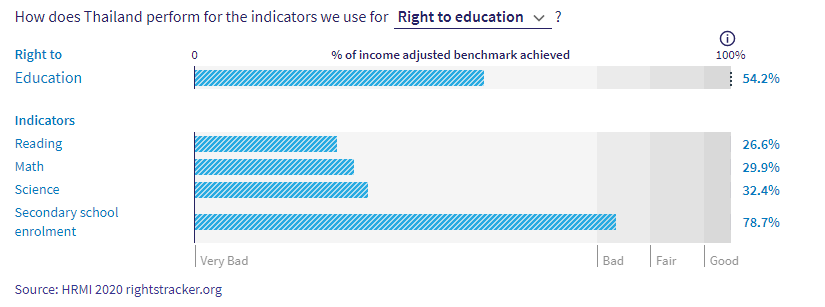
When assessing how well a country is doing in education, for example, it’s best to look at different indicators for high and low income countries. For low and middle income countries, primary school enrolment is an appropriate big-picture indicator, but for high income countries, it’s nearly meaningless, because those rates are uniformly high. So for high income countries we also look at PISA scores to see how well students are learning, even though these scores are often not available for lower income countries.
We do use all the available indicators for every country – so if a low or middle income country has PISA scores available, we will produce scores based on those as well as another set based on just enrolment rates. You can use the ‘assessment standard’ options in the sidebar to toggle between the two sets of data. Here’s Thailand again, showing first the scores based on the ‘low and middle income assessment standard’, then on the ‘high income assessment standard’.

#9: HRMI staff are available to help interpret scores for you
There’s no denying our data are complex, and plenty of people who could make good use of it to improve people’s lives might find it a bit daunting. We’d love to help! Contact us with the country and rights you’re working on, and we would be delighted to pull out the most relevant information for you and put it in context.
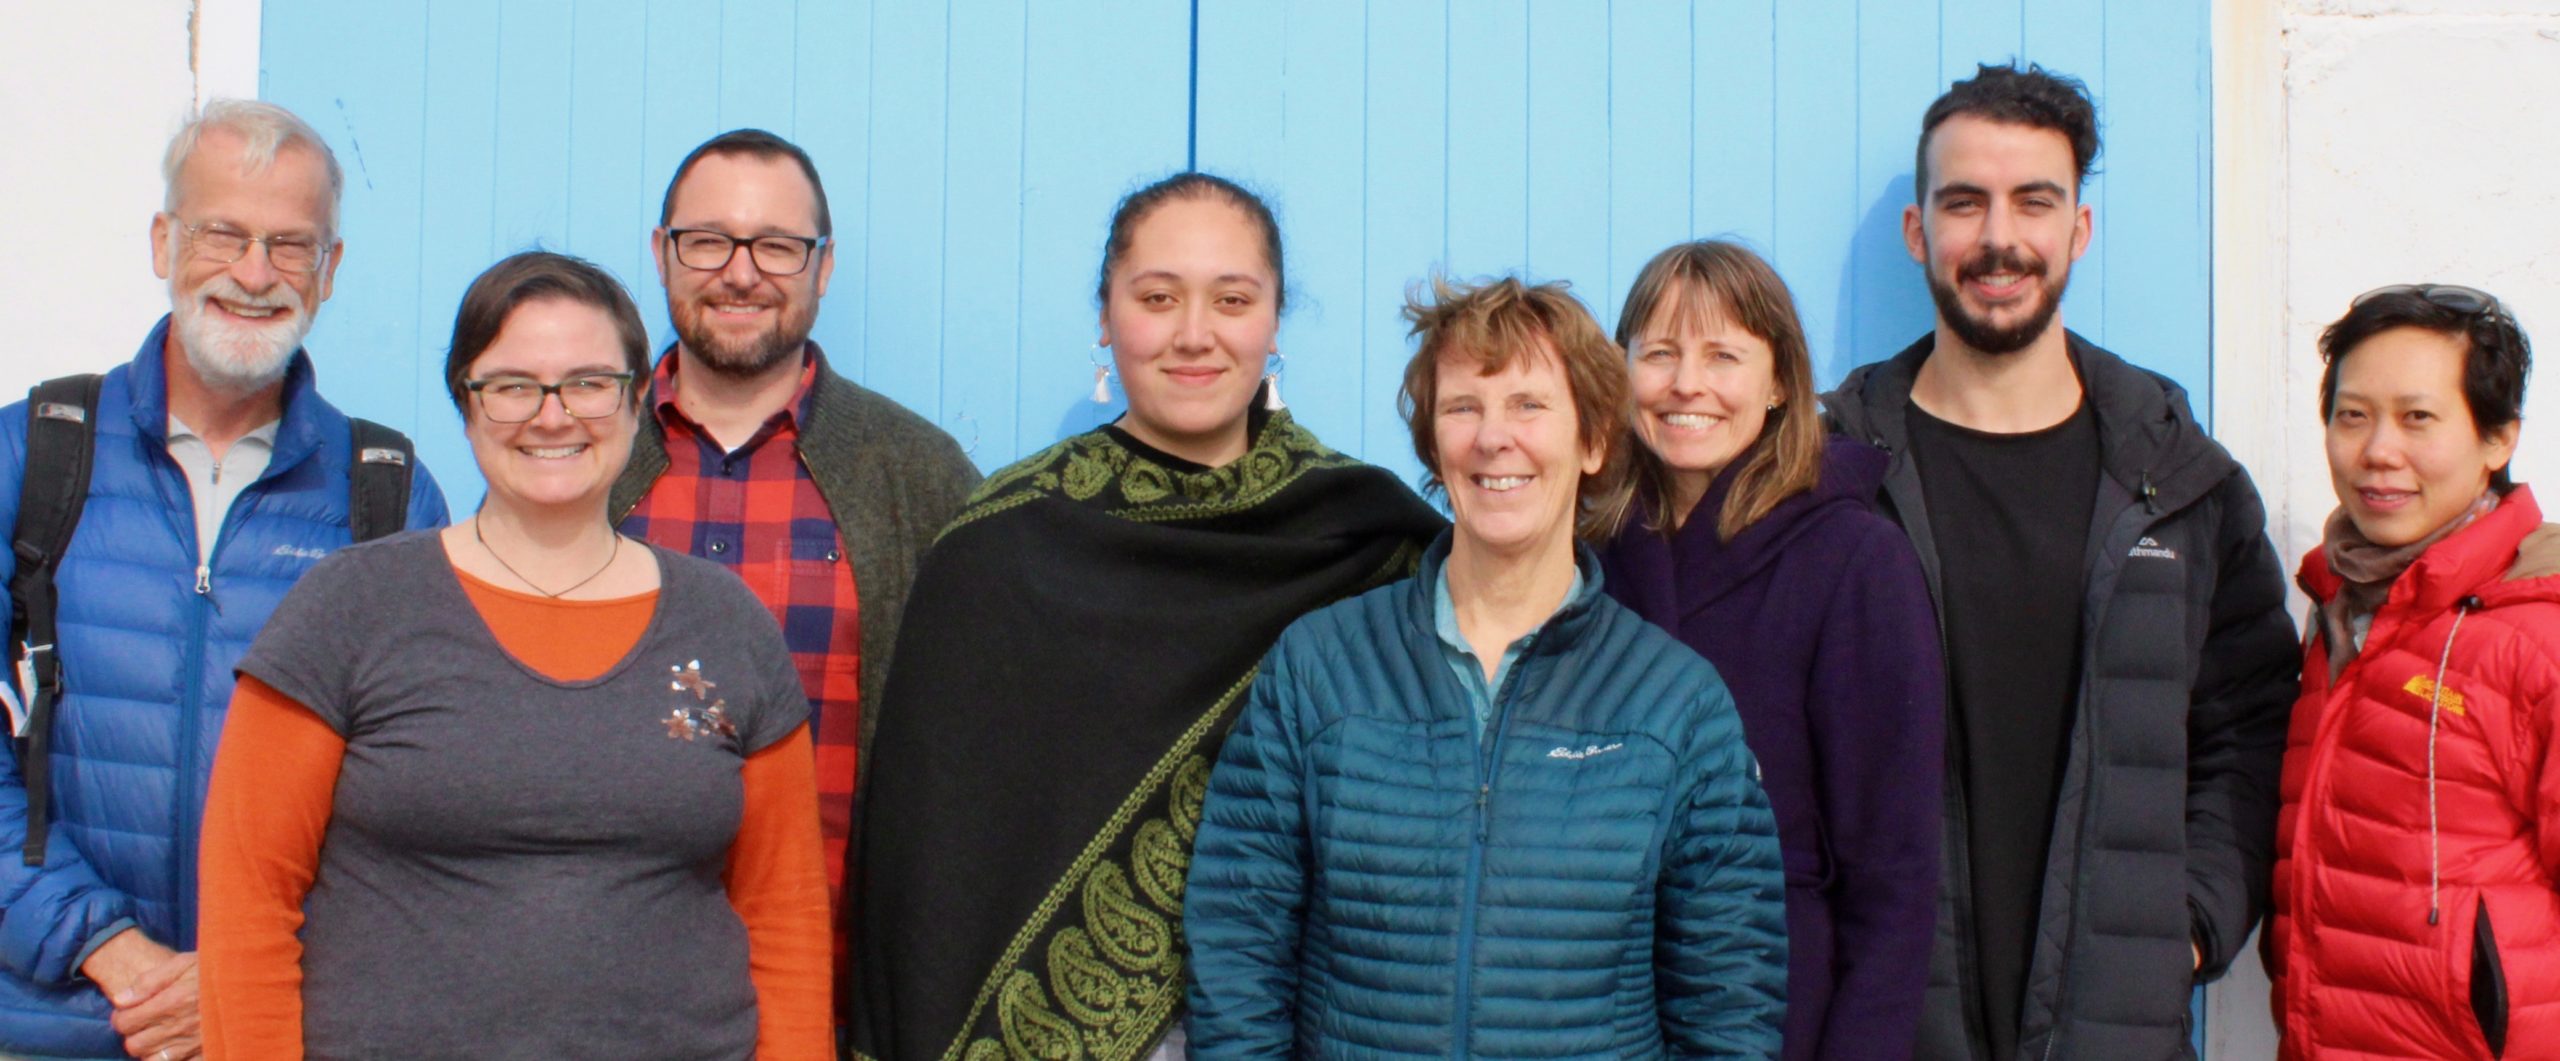
Some of the friendly HRMI team who would love to help you use our data in your work.
Each country page also includes a few sentences of description of the scores and what they mean, which you are welcome to use in your own work. For example, if we have scores for all five economic and social rights, you can read this level of detail, taken from Niger‘s country page on the Rights Tracker:
Quality of Life rights (or ‘economic and social rights’) include the rights to food, health, education, housing, and work. HRMI gives two scores, measuring against two different benchmarks.
- Niger scores 60.2% on Quality of Life when scored against the ‘Income adjusted’ benchmark. This score takes into account Niger’s resources and how well it is using them to make sure its people’s Quality of Life rights are fulfilled.This score tells us that Niger is only doing 60.2% of what should be possible right now with the resources it has. Since anything less than 100% indicates that a country is not meeting its current duty under international human rights law, our assessment is that Niger has a very long way to go to meet its immediate economic and social rights duty.
- When measured against the ‘Global best’ benchmark, comparing Niger to the best performing countries in the world, Niger’s score is 34.8%, indicating that it has a very long way to go to meet current ‘Global best’ standards for ensuring all people have adequate food, education, healthcare, housing and work.
Compared with the other countries in Sub-Saharan Africa, Niger is performing close to average on Quality of Life rights (this comparison is calculated using the ‘Income adjusted’ benchmark).
#10: HRMI can also produce sub-national scores if the data are available
The SERF Index is very flexible and if data exist, we can produce all sorts of regional or state comparisons within countries.
Some studies that have already been done using the SERF Index include:
- The United States SERF Index scores each state, putting North Dakota at the top of the table, though it still has room for improvement.
- An analysis of US state scores by race showed enormous effects of race on quality of life: the highest score for African Americans was lower than the lowest score for white Americans.
- A study on Brazil showed wide variation in rights provision along ethnic and regional lines.
- A study of India‘s 29 states considered whether a focus on increasing food production was likely to enhance food security and found that the two were not strongly connected. For instance, Uttar Pradesh produced ten times more food per capita than Kerala or Tamil Nadu, but its right to food score was the worst in India.
If you would like this kind of data for your country, talk to us! It may be possible for us to produce it for you.
The SERF Index can be used for many other research questions, too. Its creators have shown, for example, that:
- A national development strategy that prioritises economic and social rights is more likely to lead to improvement in both rights outcomes and wealth than one that prioritises economic growth.
- All kinds of governments can produce good SERF Index scores, but only democracies can protect against bad ones.
- Gender equality is associated with higher SERF Index scores.
- In all regions of the world, economic and social rights are improving, on average.


