Data for SDGs
How to use HRMI data when working with the Sustainable Development Goals
There are strong connections between human rights monitoring and the Sustainable Development Goals (SDGs). Indeed, the 2030 Agenda for Sustainable Development ‘seeks to realise the human rights of all.’ So it should not come as a surprise to learn that the Human Rights Measurement Initiative (HRMI)’s scores are an important complement to the SDGs.
This article sets out three ways in which HRMI human rights data can support comprehensive and robust SDG reporting, focusing on:
- HRMI’s independence;
- HRMI’s unique methodology which takes country income into account; and
- HRMI’s civil and political rights data, which can help monitor Goal 16.
1. HRMI data are produced independently from governments
A key feature of HRMI’s assessments is that they are independent of governments, whereas the SDGs are designed to be assessed by countries themselves.
As such, HRMI’s scores serve as a valuable source for ‘shadow reporting’ on the SDGs, allowing non-state actors to raise issues that states themselves may be ignoring or underplaying in their assessments.
HRMI is a non-profit organisation, funded by grants and donations. Elsewhere on our website you can see who funds us, and read more about our values, including independence.
2. SDG monitoring can benefit from HRMI’s unique methodology for measuring economic and social rights
Second, HRMI’s award-winning methodology for measuring country performance on food, education, health, housing and work, brings something very unique to the assessment process.
Everyone knows that it is easier for a rich country to get good education outcomes than it is for a low or middle-income country, so simply assessing each country against the same benchmarks doesn’t hold them to account equally well. Instead, HRMI assesses them relative to benchmarks that take into account each country’s level of economic development. In other words, the methodology incorporates the idea of progressive realisation, shedding light on how effectively each country is using its available resources to achieve the SDG (or other human right) indicator concerned. This means that:
- Using HRMI’s economic and social rights data will allow you to distinguish between countries that are doing poorly because they are not using their resources well, versus those that are doing the best they can with their available resources but would require additional income, development aid or technical assistance to do better.
- It will also allow you to identify the extent of the additional resources required to enable resource constrained countries to reach the different SDGs.
3. HRMI scores can help with Goal 16
Third, we note that the SDG framework has very few indicators available for monitoring Goal 16: Peace, Justice and Strong Institutions. HRMI’s civil and political rights data can help you to fill this gap.
Below we elaborate on each of these three points.
An introduction to HRMI data
HRMI’s dataset so far includes measures of 13 internationally recognised human rights acknowledged by UN member states and defined according to the International Bill of Human Rights.
Metrics for 5 economic and social rights (ESRs) are produced using publicly available statistics, and are available for around 200 countries, depending on the right. Currently we produce scores for these rights:

- education
- food
- health
- housing
- work/social security
These ESR data have strong and direct links with SDG goals 1, 2, 3, 4, 5, 6, 8, 10 and 11, as will be further discussed below.
Using a completely different methodology, HRMI also produces scores for 9 civil and political rights:

- freedom from arbitrary or political arrest and detention.
- freedom from disappearance
- freedom from execution by death penalty
- freedom from extrajudicial execution
- freedom from torture
- freedom of assembly and association
- freedom of opinion and expression
- freedom of religion and belief
- political participation
These data relate strongly to SDG 16: Peace, Justice, and Strong Institutions, where they can help to fill data gaps and allow more comprehensive monitoring.
Because publicly available statistics are not available for these rights, HRMI collects data via a detailed multi-lingual expert survey that is filled out by human rights practitioners such as lawyers, researchers and advocates. This is a labour-intensive process, so we started with a small group of countries and add more each year, as increased funding allows.
In 2024 we produced these civil and political rights data for over 40 countries. You can see an up-to-date list of our country coverage elsewhere on our website.
How to use HRMI’s economic and social rights data for the SDGs
HRMI’s economic and social rights scores are constructed from publicly available data published by international organisations such as UNESCO, the FAO, the OECD, and the Luxembourg Income Study. Many of the indicators HRMI uses to assess the different economic and social rights are the exact same indicators used to assess the SDG targets (as shown in Table 1 at the bottom of this article).
To illustrate, let’s look at Lesotho’s economic and social rights scores.
The screenshots below, from HRMI’s online Rights Tracker, show Lesotho’s performance measured against two different benchmarks: first, the ‘income adjusted’ benchmark, then the ‘global best’ benchmark.

The income adjusted benchmark, drawn from the award-winning SERF Index methodology, evaluates each country’s performance relative to the best outcomes other countries have achieved at that country’s per capita income level. The global best benchmark evaluates performance compared to the best results in the world, disregarding income constraints.
Lesotho’s scores on the income adjusted benchmark, above, show how effectively it is using its current resources to achieve that right or goal. HRMI’s scores on this benchmark measure the progressive realisation of rights, and show whether countries are meeting their obligations to devote the maximum of their available resources to achieving good rights outcomes for their people.
In the case of Lesotho, which has a very low GDP per capita, we can see above that it is using its (meager) available resources best with respect to realising people’s right to education. Its current score of 81.8% on the right to education is good, nonetheless there is room for improvement with its current resources. Our methodology takes income into account, so every country should be able to get near 100%. However, for the right to housing, Lesotho’s very low score suggests that even with its low level of resources, it could achieve a lot more for people.
By contrast, the global best benchmark doesn’t consider income constraints, and makes it clear how far away full enjoyment of rights is for the people of Lesotho.
The screenshot below shows Lesotho’s scores using the global best benchmark. This compares Lesotho’s performance with the best outcomes of other countries at any income level, including the wealthiest countries in the world. The 100% benchmark represents the maximum enjoyment level of each right that is feasible given current knowledge.
The difference in the benchmarks can give us insight into the level of resources that would be required to enable the country concerned to fully realise the right or goal concerned.
When we compare Lesotho’s health achievements with what’s possible in the richest countries, we see that there is a large gap between their current performance and what they could aspire to if they had more resources.
This shows the role that income constraints are playing in preventing people in Lesotho from enjoying their right to health.

Now consider Myanmar’s right to food score of 69.6% (income adjusted score) and 66.0% (global best score). The Rights Tracker screenshot below shows the global best score. The dotted line near the 100% mark shows the target Myanmar could be expected to reach when its income is taken into account.
There isn’t much difference between what we expect Myanmar’s government could achieve at its level of income, and what it could achieve if it had all the resources it needed. The message to leaders in Myanmar is that resources are not holding it back very much – there are other factors, probably within its control, that are stopping it from realising people’s rights.
For Myanmar, the conclusion is that by using its available resources more effectively, and reaching its income adjusted target, it would also be close to the global best – all without requiring additional resources.

HRMI’s database is freely available on our Rights Tracker. Country progress in meeting the SDGs concordant with HRMI’s ESR indicators can readily be tracked using either the income adjusted or global best standard over the past decade.
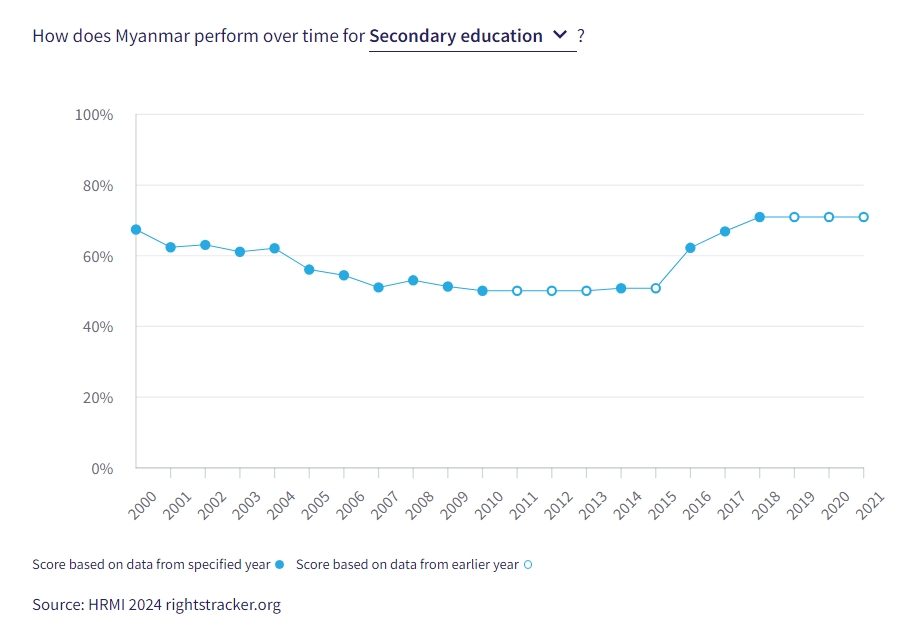
To provide an example of progress over time, the graph below shows progress on one indicator relevant to SDG 4: Quality Education. Target 4.1 is focused on ensuring all children have access to secondary school:
by 2030 ensure that all girls and boys complete free, equitable and quality primary and secondary education leading to relevant and effective learning outcomes.
This chart shows that although Myanmar has made considerable progress, the fact that its score remains well below 100% tells us that much more could be done, even at its current per capita income level.
Using HRMI’s civil and political rights data to help monitor SDG 16
HRMI’s civil and political rights (CPR) data directly align with SDG 16: Peace, Justice, and Strong Institutions, and in particular those targets focused on providing access to justice for all and building effective, accountable, and inclusive institutions at all levels.
Our CPR scores are available on the Rights Tracker for a sample of over 40 countries in 2024, rising each year. We are ready to cover all countries as soon as funding permits. Scores are produced using a peer-reviewed expert survey methodology.
We produce scores for 3 empowerment rights, and 5 rights tracking people’s ‘safety from the state’ abuse.
To give an example, the Rights Tracker screenshot below shows the United States’ scores on the 5 aspects of safety from the state we measure.
Countries are scored on a 10 point scale on each right where a higher score implies better performance. Uncertainty about each country’s precise score is represented by uncertainty bands: the 80% certainty band is shown by the purple bar while the mid-point score shown is the best estimate of the country’s performance. These scores, and the country comparisons available on the HRMI Rights Tracker, show that the United States’ performance on SDG 16 is seriously lacking in several regards.

HRMI data can help focus on gender equality and vulnerable populations
As is consistent with the International Bill of Rights, the SDGs place emphasis on promoting gender equality and protecting vulnerable populations. HRMI’s metrics incorporate ways of assessing both of these concerns.
First, HRMI’s ESR scores on the rights to food, education and health are disaggregated by sex whenever possible. You can see disaggregated scores on the Quality of Life tab of every country page on the Rights Tracker.
Second, the expert survey collects information from survey respondents on which people are at heightened risk of violations of each right.
We show this information in the form of a word cloud for the right to freedom from the death penalty, as in the screenshot below.
This image tell us that for the United States, 33% of survey respondents identified people who are migrants and/or immigrants as being at greater risk than the general population of violation of the right to freedom from forced disappearance .

Shared HRMI and SDG indicators
The table below shows the match between the indicators HRMI uses to assess countries on their human rights performance and the SDG targets and indicators.
Note that because some of the indicators collected for low- and middle-income countries differ from those collected for high-income countries, and because the human rights challenges differ between the two sets of countries, HRMI metrics offer two assessment standards: one most relevant to low- and middle-income countries, and the second most relevant to high-income countries. We use these ‘default’ collections of indicators to calculate the scores we display first on the Rights Tracker, but we calculate scores for all countries on all available indicators.
The first column shows the indicators HRMI uses to assess each right for both assessment standards (indicated in columns two and three).
Column 4 shows the related SDG, column 5 shows the SDG target number concerned, and column 6, the specific SDG indicator number where relevant.
The HRMI ESR indicator names are specified in terms of rights enjoyment rather than the deficit. So, for example, while SDG target 2.2.1 is specified as the ‘prevalence of stunting among children under 5’, the HRMI indicator is specified as the ‘percentage children under 5 who are not stunted.’
Table: Concordance between HRMI economic and social rights and the Sustainable Development Goals
| HRMI Rights and Indicators
|
Assessment Standard | SDG | SDG Target Number | SDG Indicator Number | |
| High Income | Low and Middle | ||||
| Right to Food | 2: End hunger, achieve food security and improved nutrition and promote sustainable agriculture | ||||
| Percentage children under 5 not stunted | √ | 2 | 2.2 | 2.2.1 | |
| Percentage population not moderately or severely food insecure | √ | 2 | 2.1 | 2.1.2 | |
| Right to Education | 4: Ensure inclusive and equitable quality education and promote lifelong learning opportunities for all.
1: End poverty in all its forms everywhere. 5: Achieve gender equality and empower all women and girls. |
||||
| Total net primary school enrolment rate & by sex | √ | 4, 1, 5 | 4.1, 4.3, 1.2, 4.5, 5.1 | ||
| Total net upper secondary school enrolment rate & by sex | √ | √ | 4, 5 | 4.1, 4.3, 4.5, 5.1 | |
| % of students achieving level 3 or better on PISA reading test & by sex | √ | 4, 5 | 4.1, 4.6, 4.5, 5.1 | 4.1.1 | |
| % of students achieving level 3 or better on PISA math test & by sex | √ | 4, 5 | 4.1, 4.6, 4.5, 5.1 | 4.1.1 | |
|
% achieving level 3 or better on PISA science test & by sex |
√ | 4 | 4.1 4.6, 4.5, 5.1 | ||
| Right to Health | 3: Ensure healthy lives and promote wellbeing for all at all ages.
1: End poverty in all its forms everywhere. 5: Achieve gender equality and empower all women and girls. |
||||
| Child (under 5) survival rate & by sex | √ | √ | 3, 1, 5 | 3.2, 1.2 | 3.2.1 |
| Adult (15-60) % survival rate & by sex | √ | 3, 5 | |||
| % newborns not low birth weight | √ | 3 | 3.2, 2.1 | ||
| % women (15-49) using modern contraceptive methods | √ | 3, 5 | 3.7, 5.6 | 3.7.1 | |
| Right to Housing | 6: Ensure availability and sustainable management of water and sanitation for all. 1: End poverty in all its forms everywhere.
11: Make cities and human settlements inclusive, safe, resilient and sustainable. |
||||
| % population with basic water access on premises | √ | 6, 1, 11 | 6.1, 6.2, 1.4, 11.1 | ||
| % of poorest income quintile with access to affordable housing | √ | 6, 1, 11 | 1.4, 6.1, 6.2, 11.1 | ||
| % population with at least basic sanitation | √ | 6, 1, 11 | 6.2, 1.4, 11.1 | ||
| % population.4 with safely managed sanitation | √ | 6, 11 | 6.2, 11.1 | 6.2.1 | |
| Right to Work | 1: End poverty in all its forms everywhere.
4: Ensure inclusive and equitable quality education and promote lifelong learning opportunities for all. 8: Promote sustained, inclusive and sustainable economic growth, full and productive employment and decent work for all. |
||||
| % population with at least $3.65 (2017 PPP$) per day | √ | 1, 8 | 1.1, 8.3, 8.5 | ||
| % population with >50% median income | √ | 1, 10, 8 | 1.2, 10.2, 10.3, 8.3, 8.5 | 10.2, 1.2.1 | |
| % unemployed not long-term unemployed | √ | 8, 4 | 8.5, 4.4 | ||
Data in action
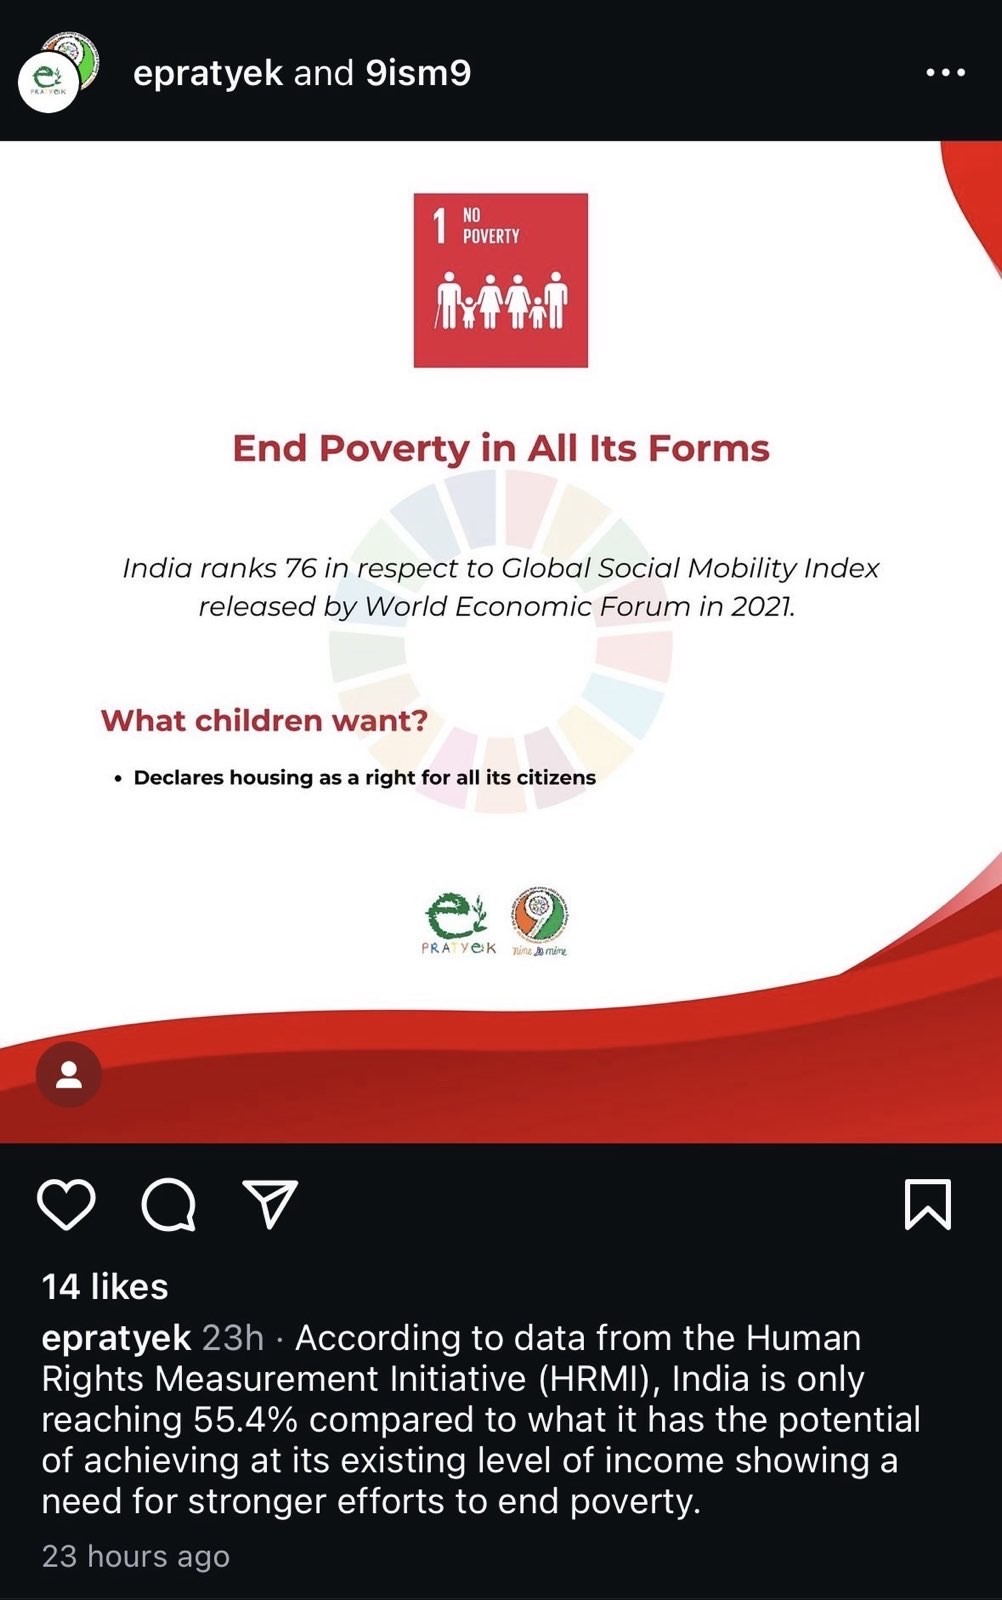
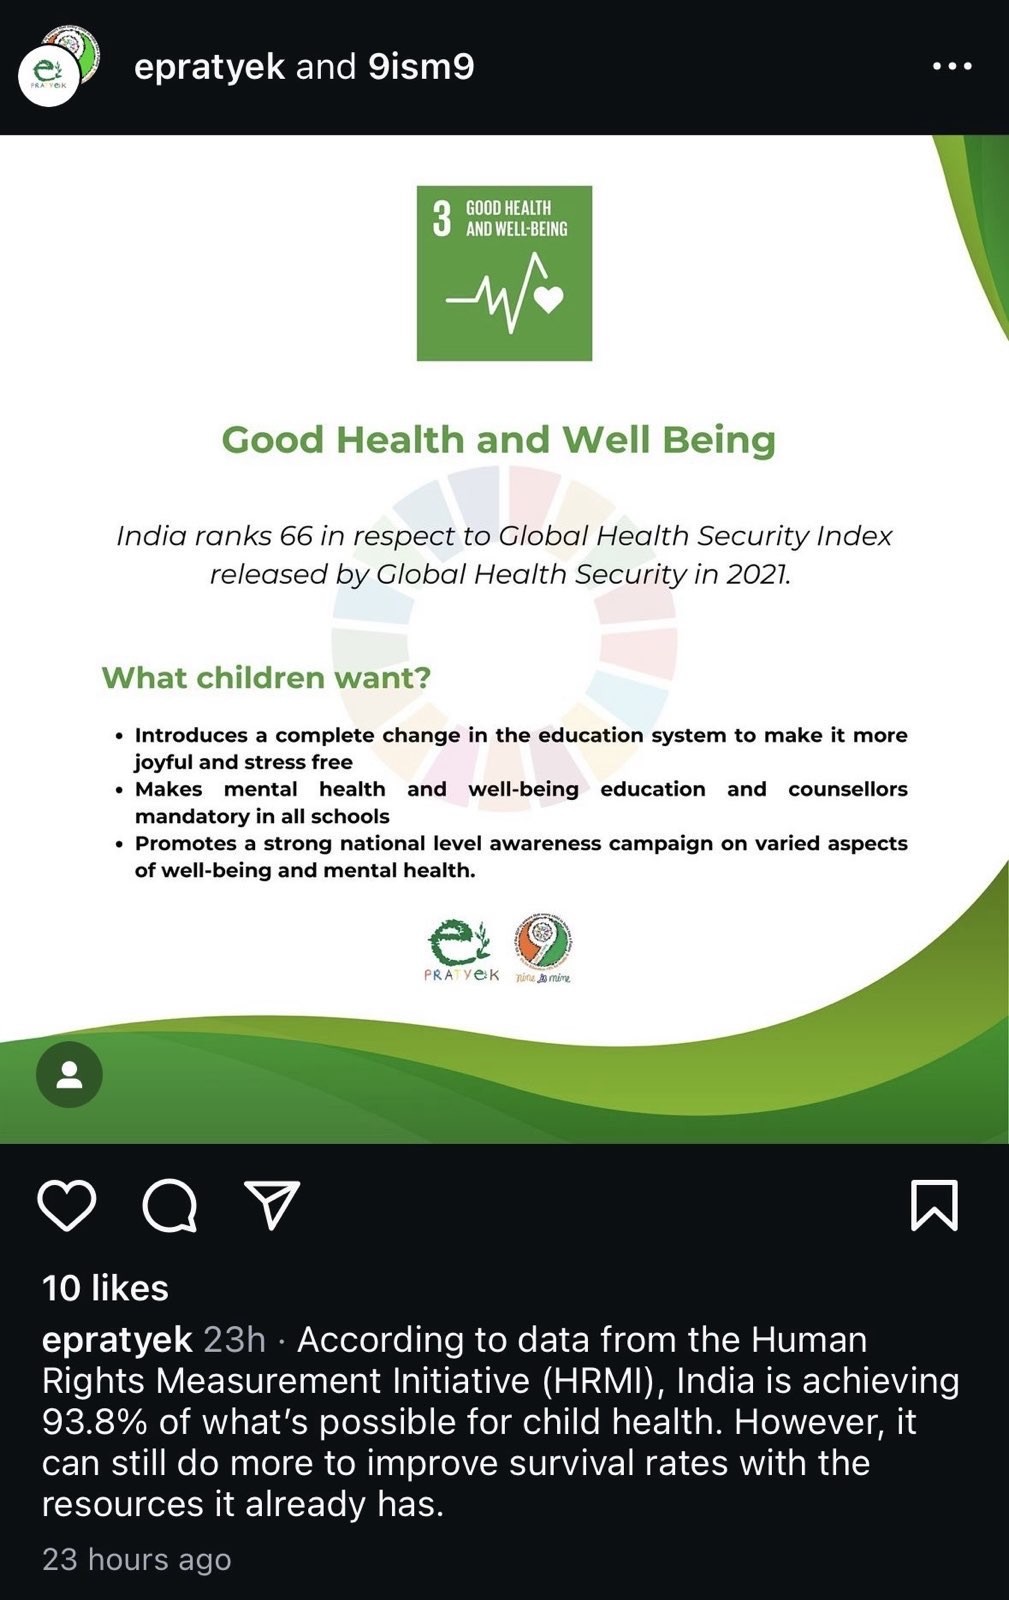
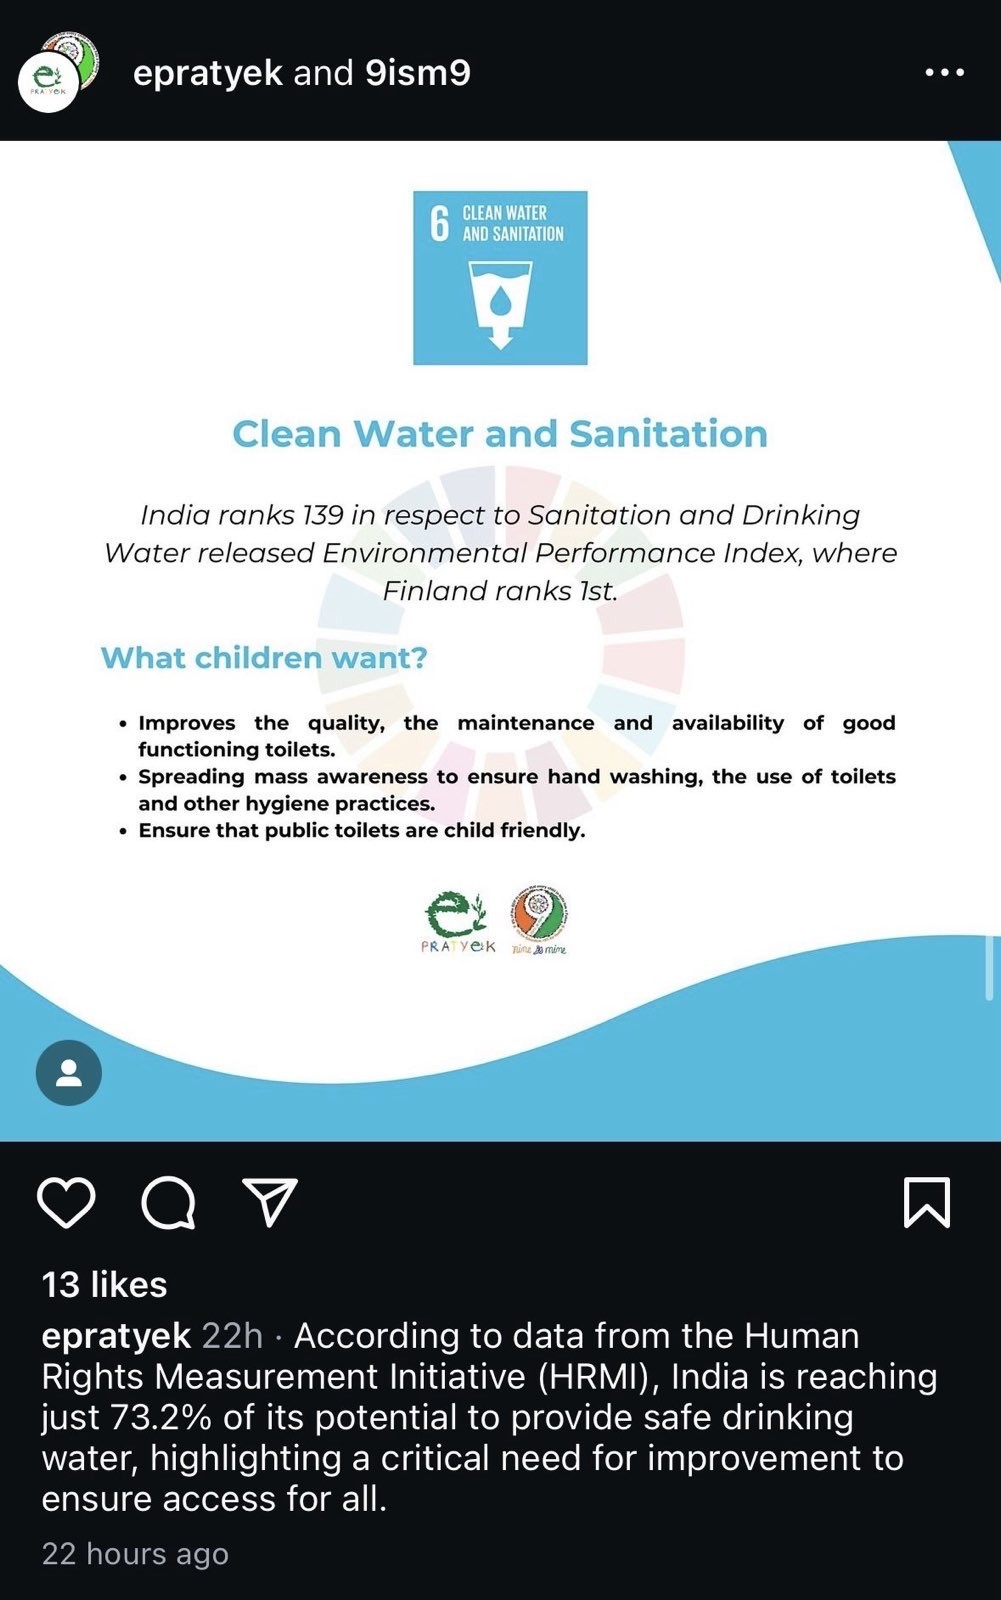
Here are examples of how PRATYeK, an NGO focusing on child rights, extensively used HRMI data lining up with various SDGs for their Global Goals Week campaign. The captions for each image outline the HRMI scores related to each goal.
We can help!
If you are working on the SDGs, please feel free to get in touch with us. We are happy to help you find the data that’s most relevant, or to check your work for accuracy when you use our data.
We would love to hear from you if you’re using our data, or if you have suggestions for other ways we could present our work to make it useful for you.

